What is Audiogram Chart?
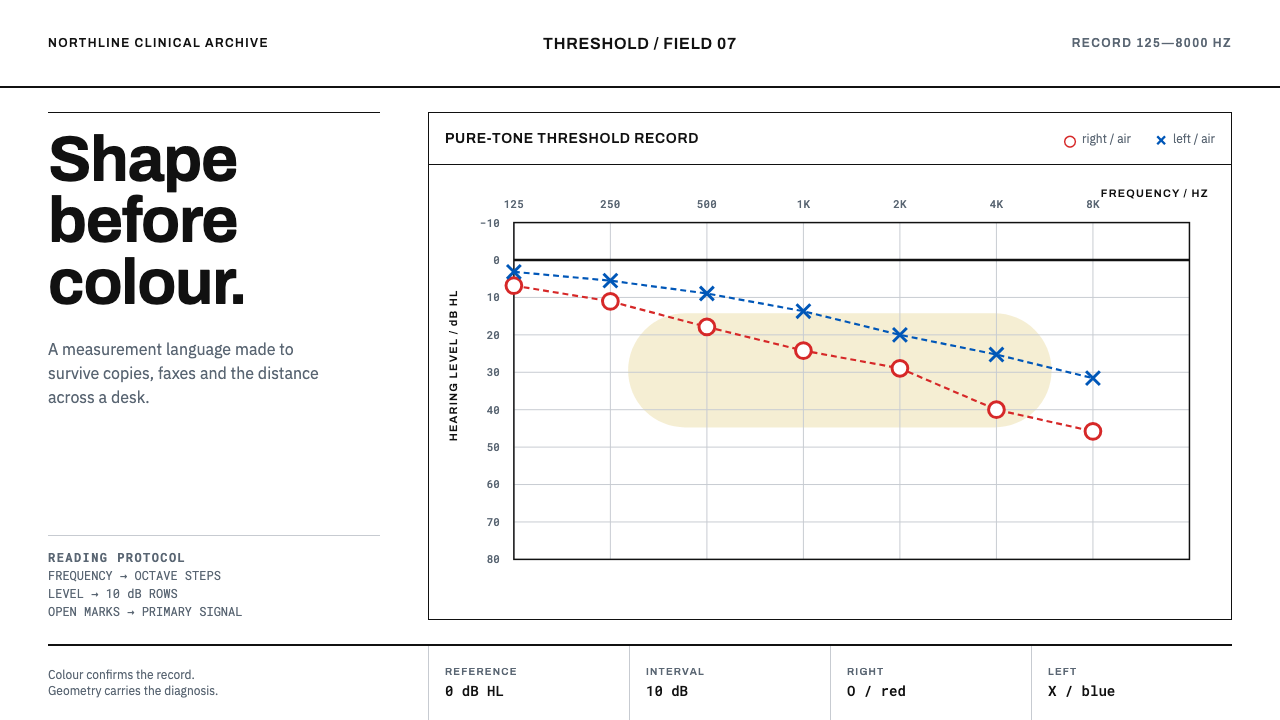
An audiogram is a form that tells the truth in shapes — an open red circle for one ear, a blue cross for the other — and that discipline is what makes it a model for any chart that must survive a bad photocopy.
Audiogram Chart in brief
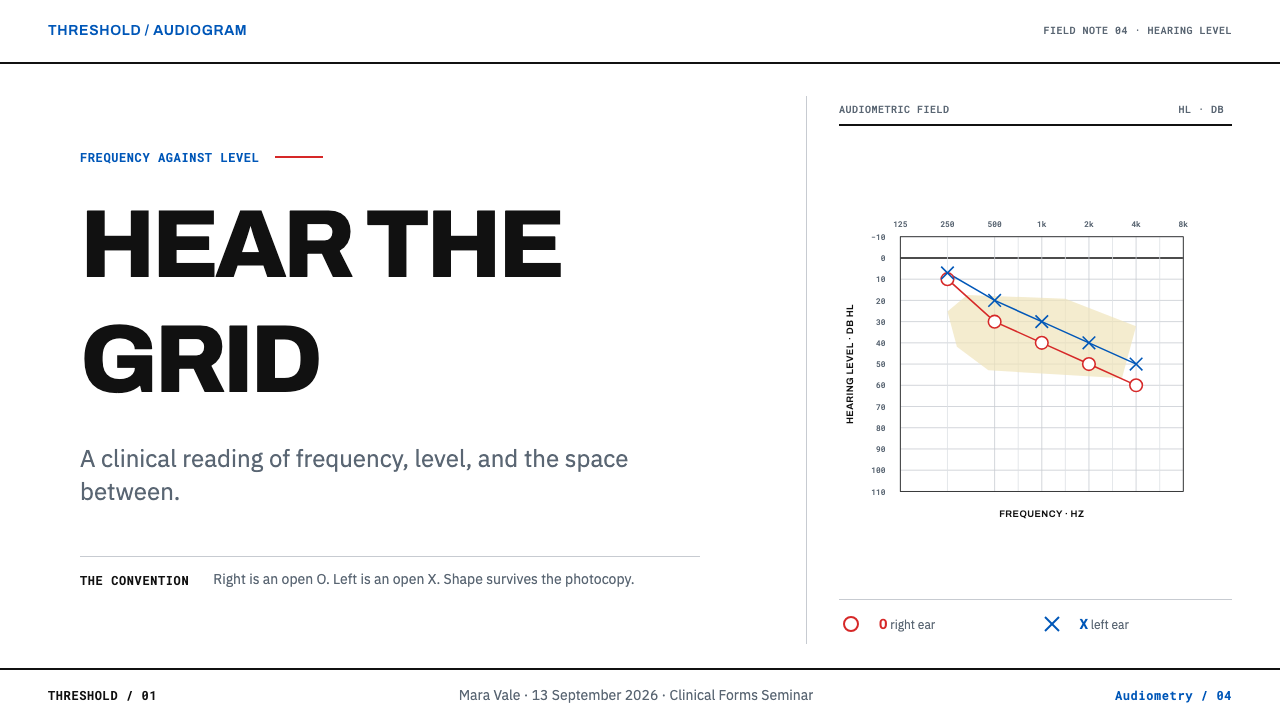
The Audiogram Chart style comes from the clinical form on which pure-tone hearing thresholds are recorded. Frequency in hertz runs across the top in octave steps, and hearing level in decibels runs down the side, so that the poorer the hearing, the lower the mark sits. Both ears are plotted on the same grid: the right ear as a red O, the left ear as a blue X, and bone conduction as brackets that face the reader like a pair of ears. It is a form rather than a chart style, and its design is a matter of protocol.
The governing idea is redundancy. Shape carries the meaning and colour only confirms it, so the whole form still reads after a poor photocopy, a fax or a trip through a patient file. Nothing is filled, glossy or dependent on hue alone. A mark is recognised by its outline, a series by its symbol, the grid by its restraint. The discipline worth borrowing is that every piece of information is encoded at least twice.
Visually the form is austere: white paper, hairline grid lines, a slightly heavier horizontal rule at the zero level, small open symbols and, behind the data, a soft pale region known as the speech banana that shows where the sounds of speech fall. Red and blue are present, but in small doses and with fixed meanings. There are no gradients, no shadows and no flourishes. The goal is a page that can be read cleanly even when it is printed small.
Where does Audiogram Chart come from?
The source material dates the form to roughly 1950 to 1990, the period in which pure-tone audiometry and the standard threshold form became routine clinical practice. Pure-tone audiometry asks a listener to indicate the quietest tone they can just detect at each of a series of frequencies; the audiogram is simply the record of those answers. Plotting them on a fixed grid turned a conversation between clinician and patient into a document that other clinicians could read at a glance.
The ideas under the form come from psychoacoustics, the study of how physical sound becomes perceived sound. Harvey Fletcher is one of the reference figures here: his research on hearing and the perception of sound helped establish the way scientists think about thresholds and loudness across frequency. Georg von Békésy is the other: his experiments on how the inner ear responds to different frequencies earned him a Nobel Prize, and his name is also attached to a self-tracing method of audiometry. The grid is a map of the ear's sensitivity, and the curved region of speech sounds behind the data is a trace of that science.
Standardisation made the form portable. The audiogram sits within ASHA- and ISO-aligned clinical documentation, a global system of conventions in which the axes, the symbols and even the colours are fixed so that a chart drawn in one clinic can be read in another. Right ear in red, left ear in blue, circles and crosses for the ears, brackets for bone conduction: these are not stylistic choices but an agreed vocabulary. Standardised medical record forms of this kind prize consistency over expressiveness, and every decision on the page serves unambiguous reading.
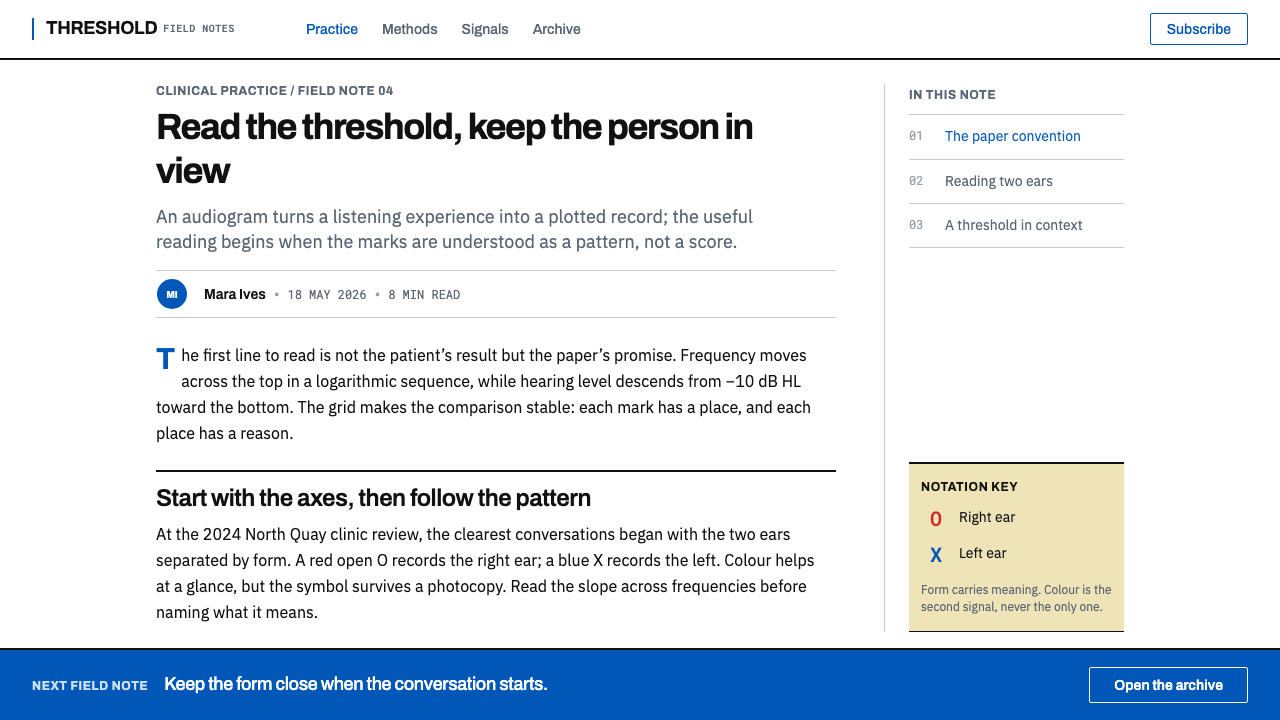
The form also had to survive the life of a medical record. It would be copied, faxed, slipped into a file and read years later by someone who had never seen the original. That is why the zero line is a little heavier, the symbols are open rather than filled, and colour is a second signal rather than the first. The audiogram comes from a clinical, institutional culture of design without a designer: every feature earned its place by preventing a misreading. For anyone borrowing it, it offers a rare lesson in making data trustworthy under bad conditions.
What defines the Audiogram Chart look?
Octave Frequency Axis
Frequency runs across the top in octave steps, so equal distances on the page mean equal musical intervals rather than equal differences in hertz. Labels sit above the grid, where a reader scanning a record expects to find them. The axis teaches a general lesson: choose a scale that matches how the subject is perceived, and label it where the eye lands first.
Descending Level Axis
Hearing level runs down the side from just above zero, so a worse threshold is plotted lower. The chart is inverted on purpose: down means more loss, and a healthy ear draws a line that stays near the top. That unusual direction is a convention to preserve, not an error to correct. The zero line is drawn heavier than the rest of the grid and anchors the whole page.
Open Symbol Vocabulary
The right ear is an open circle, the left ear an open cross, and bone conduction a bracket that opens toward the reader. All marks are outlines, never solid dots, so overlapping points stay visible and the grid line behind a symbol is not hidden. The vocabulary is small, geometric and distinguishable at a glance, which is exactly what a symbol set should be.
Colour as Confirmation
Red marks the right ear and blue the left, but only as a second signal. The symbol alone says which ear, and the colour merely agrees. This redundancy means the chart works in greyscale, for colour-blind readers and after poor reproduction. In practice, red here is a label, not an alarm, and blue is a label, not a mood.
Hairline Clinical Grid
The grid is drawn with very fine lines on plain white paper, with a slightly stronger line at the zero level and at key divisions. It is dense enough to read values against and light enough that data marks always dominate it. Grid lines are there to be consulted, not seen, and they never turn into boxes, cards or fills.
The Speech Banana
Behind the data sits a soft, pale region, shaped roughly like a banana, that marks where the sounds of speech fall on the frequency and level axes. It is the only area tint on the page, kept so gentle that it never competes with the marks. The device shows how to add meaning behind data: quietly, with a shape that has its own name, and without changing how the data reads.
A Form, Not a Chart
An audiogram is a form, with a place for a name, a date, a legend and a key to the symbols, not just a plotting area. Labels are set small and precisely. The legend is part of the design rather than a footnote, and it uses the same symbols as the data. This produces a document that explains itself and can be filed, a quality that too many modern charts lack.
Who shaped Audiogram Chart?
Harvey Fletcher was an American physicist whose research on hearing and the perception of sound laid foundations for psychoacoustics and for the measurement of hearing across frequency. He stands for the scientific idea behind the grid: that hearing can be measured, compared and plotted against frequency, and that the same quantity can be tracked from one listener, or one ear, to another.
Georg von Békésy was a Hungarian-born physicist and physiologist whose experiments on how the inner ear responds to different frequencies earned him a Nobel Prize. His name is also attached to a self-tracing method of audiometry in which the listener traces their own threshold. He represents the bridge between physiology and the clinic: understanding of the cochlea becomes a form that a technician can fill in.
ASHA- and ISO-aligned documentation provides the standard vocabulary of the form: which axis runs which way, which symbol means which ear, which colour confirms it. Standards bodies are not designers, but their work is a form of design, because a convention agreed once and used everywhere removes the need for each clinic to invent its own. They are the reason an audiogram reads the same in different places.
Clinical audiologists are the people who administer the test and fill in the form, often by hand, and read it for a living. They are the movement behind the style: clinical audiology as a practice in which a legible record matters more than an attractive one. The form is designed around their needs, namely quick filling, quick reading and unambiguous marks, and a faithful design carries those needs forward.
How do you use Audiogram Chart today?
Audiogram Chart is a style for information that must be read correctly, not just seen. It suits health, science, engineering and finance contexts where trust matters more than flourish. Its strengths are structural: shape-coded symbols, hairline grids, redundant colour and a form that explains itself. Apply those and the result will feel clinical in the best sense — precise, calm and dependable.
For presentation slides, build the cover like a form header: a title, a short key line and a hairline rule on plain white, with one open symbol as the only graphic. Content slides can be labelled grids with a legend of symbols. Data slides are where the style shines, with threshold-style plots, open markers, a distinct shape for each series, and a soft shaded band behind the data for the zone that matters, such as a normal range or a target. Keep every slide legible if the deck is printed in black and white.
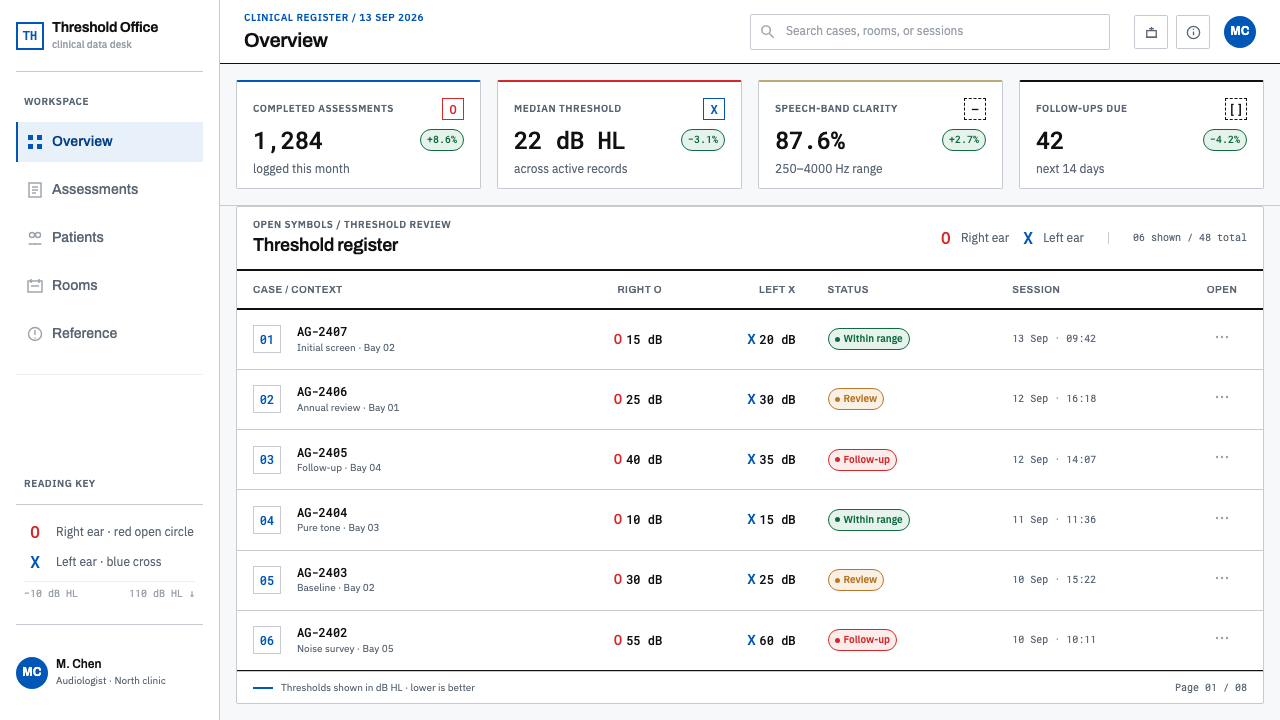
For web interfaces, apply the style to dashboards, monitoring views, analytics and clinical or wellness tools. Give every chart series its own marker shape in addition to colour, shade the acceptable range lightly behind the data, keep the grid at hairline weight, and place the legend next to the chart. Data tables can carry symbol keys. Forms should have precise small labels and clear grouping. In comparison tables, use outline marks and text rather than filled badges.
For editorial and marketing work, the style suits health explainers, patient information, scientific communication, annual reports, data journalism and hearing-health brands. Pair small, honest charts with plain captions, borrow the speech-banana idea to highlight what matters in a single soft region, and keep text calm and factual. The tone it gives is reassuring because it never over-claims: it shows exactly what was measured, no more.
The common mistake is to soften the form: filling the symbols, adding gradients and shadows, or making the zero line the same weight as everything else. A second is relying on colour alone, which defeats the redundancy that makes the style work. A third is treating red as danger and blue as calm; here they simply mean right and left. A fourth is decorating the page with ear illustrations and sound waves, which adds noise to a design whose value is silence.
Audiogram Chart — FAQ
Why is the hearing-level axis upside down?
By convention the axis starts near zero at the top and runs downward, so the worse the threshold, the lower the mark sits. A healthy ear therefore draws a line near the top and hearing loss reads as a drop. The orientation is a clinical convention that makes the chart look like a profile of lost sensitivity. In design terms it is a deliberate choice to be preserved wherever you use this style for threshold-type data, rather than flipped to match a general-purpose chart habit.
Does red mean bad and blue mean good?
No. Red marks the right ear and blue marks the left, and that is all. Colour confirms the symbol rather than judging the result. The audiogram deliberately avoids using hue to signal quality, because a reader needs to see both ears at the same level of importance. If you adopt the convention in other contexts, assign red and blue to categories that are equal peers, such as two groups, two conditions or two sides, not to good and bad outcomes.
Can I use this style for charts that aren't hearing data?
Yes, as long as you keep the principles. Use a distinct open symbol for each series, secondary colour that only confirms, hairline grid lines with one stronger reference line, and a soft shaded band for the zone that matters. It works well for any threshold-style or range-based data: sensor readings, service levels, test results, comparisons against a normal range. It works less well for charts whose point is emotional impact rather than precise reading.
Why are the symbols open rather than filled?
Open symbols preserve information. Where two marks overlap, outlines remain distinguishable, while solid dots merge into a blob. The grid line behind an open symbol is still visible, so the reader can see exactly where the mark sits. Open shapes also survive bad reproduction far better, since a thin outline degrades gracefully while a filled shape can bloom or vanish. The restraint is the point: the symbol identifies, and the grid locates.
Does the style work on a dark background?
This theme is a light one, built around white paper and hairline lines. A dark version is possible for screens, but thin outlines and soft tinted regions are more delicate on dark grounds, and both the open symbols and the subtle speech-banana region can lose legibility. If you invert it, lighten the strokes, increase the contrast of the symbols, keep the shape coding, and test that every series is still distinguishable without colour.
Related design styles
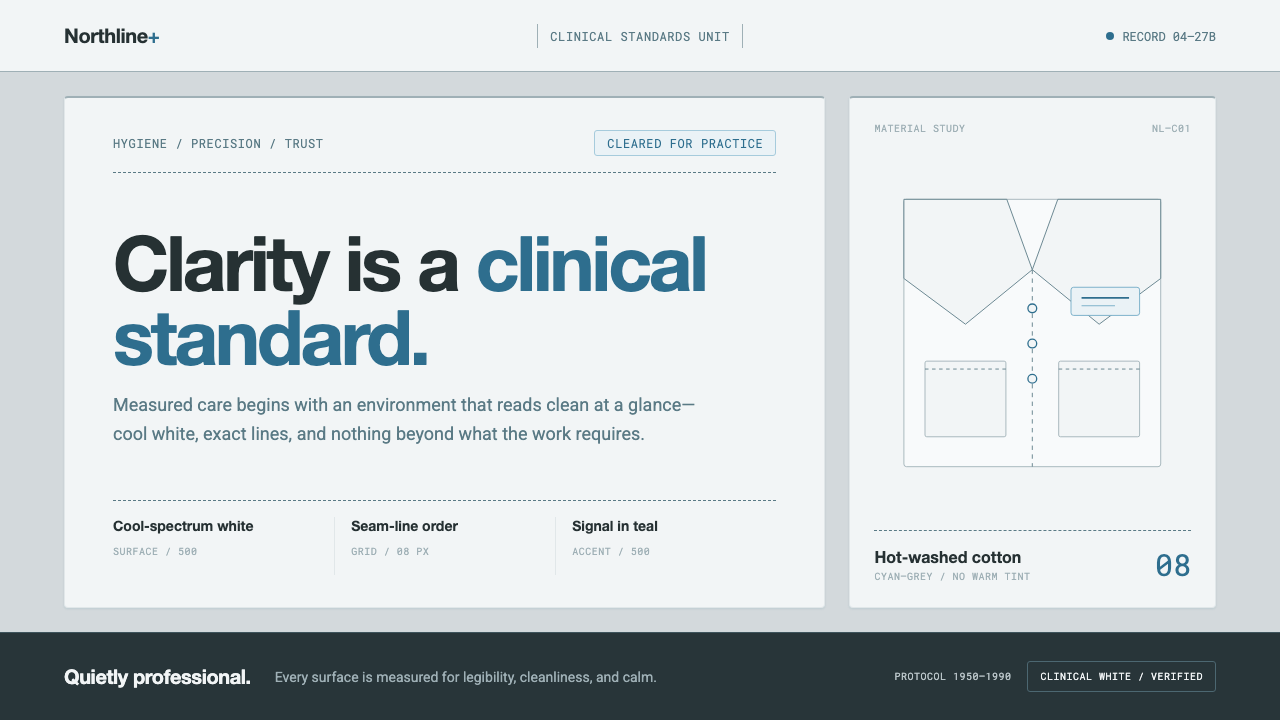 Doctor's Clinical Lab CoatSterile by design. Cool clinical white, teal signals, and seam-line grids enf…
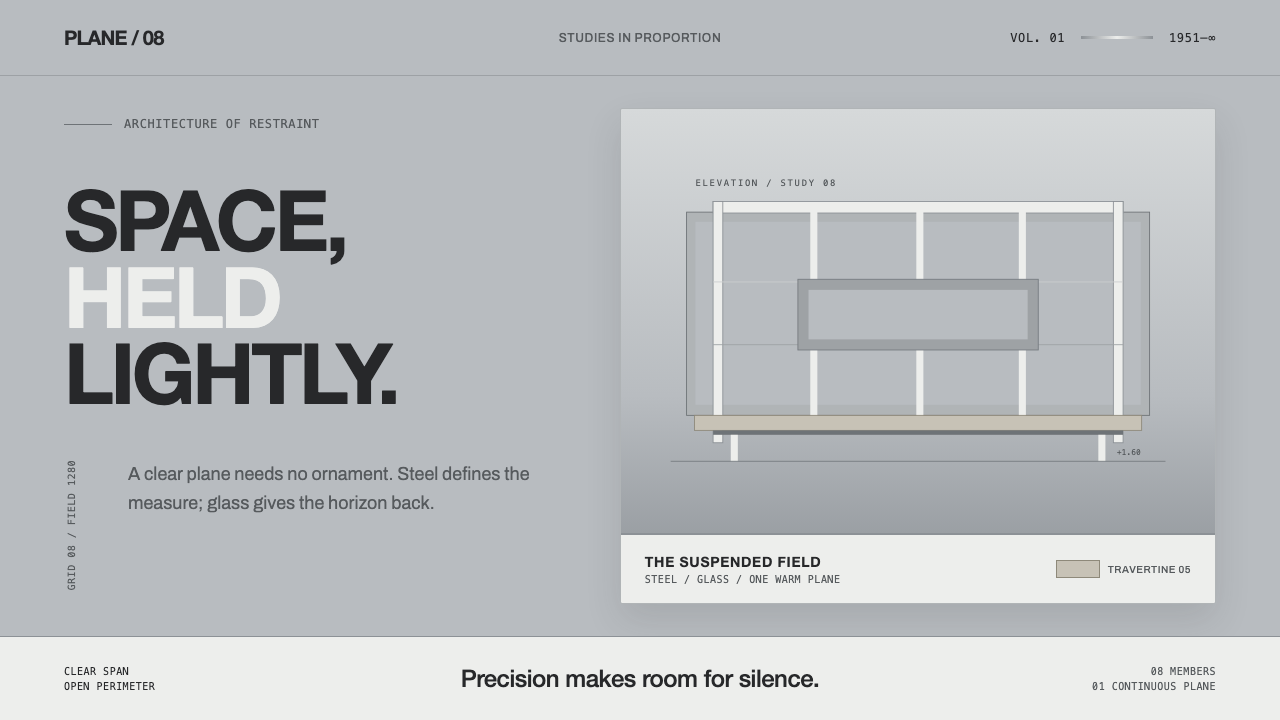 Farnsworth HouseWeightless by precision. White steel planes float across reflective gray with…
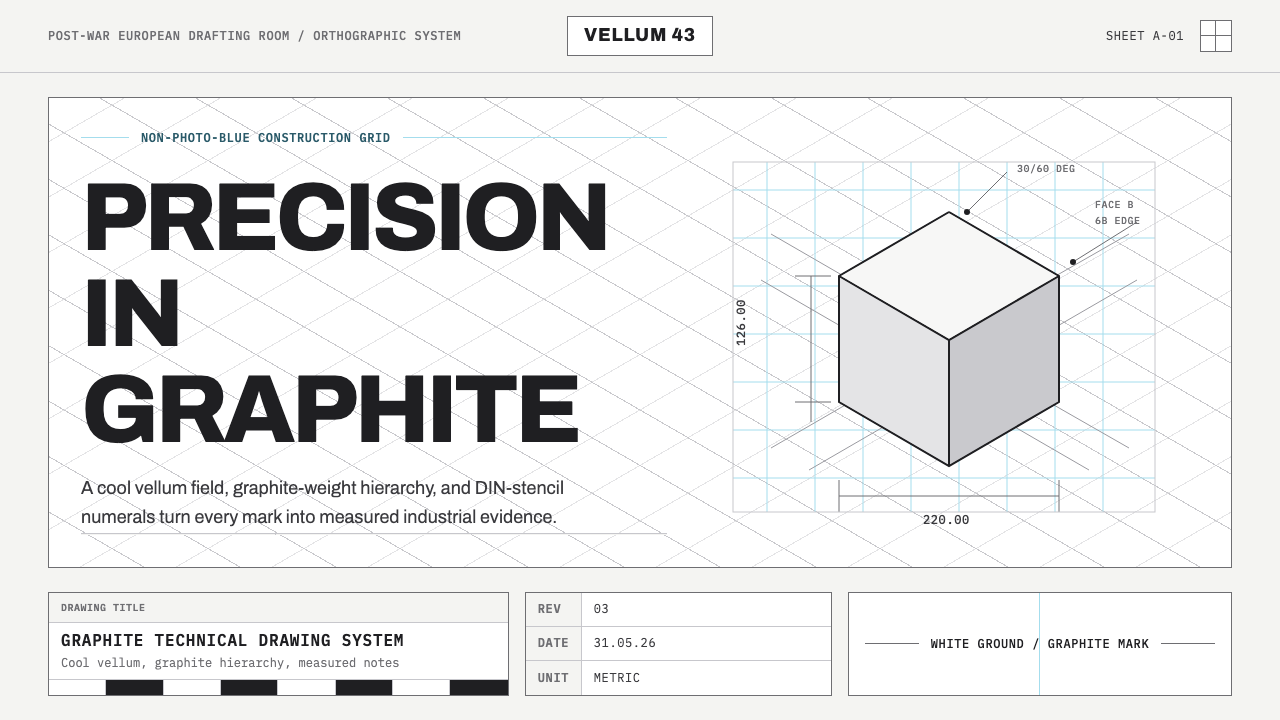 Graphite Technical DrawingDrafting-room precision. Non-photo-blue grid and graphite DIN lettering do th…
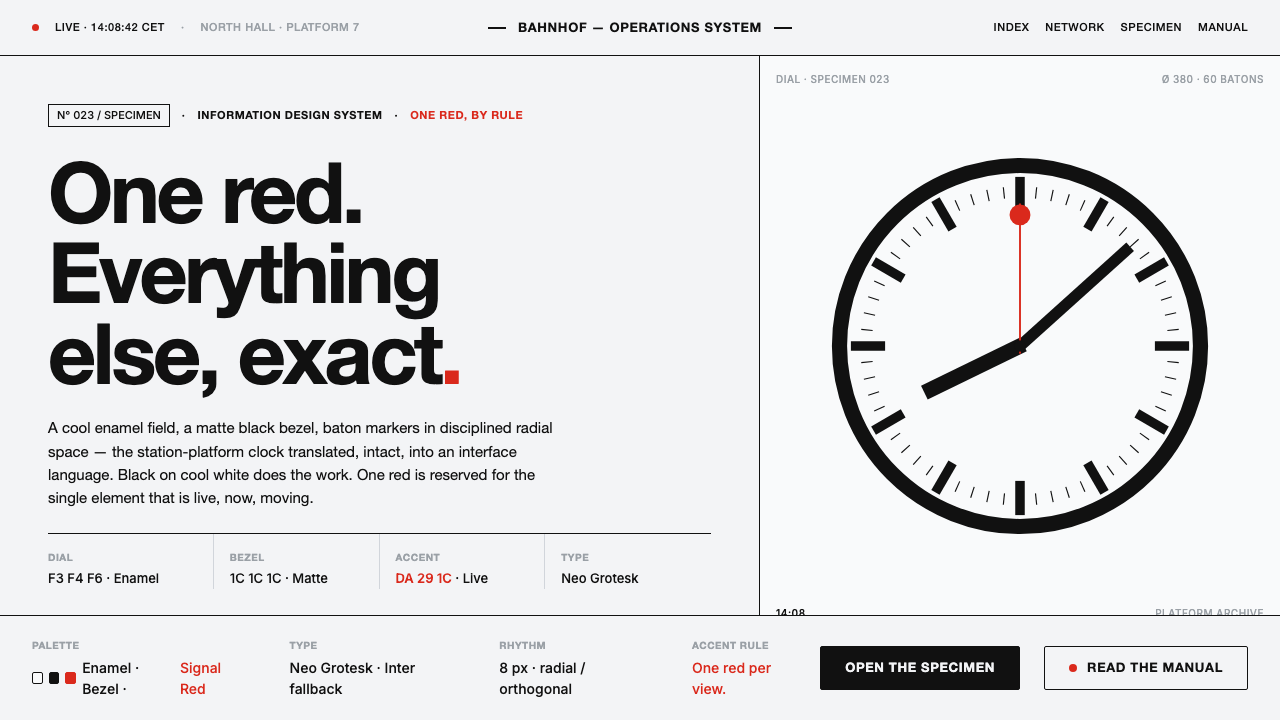 Hilfiker Railway ClockEverything exact, one thing live. Black hands on cool enamel white — one red…
 IBM Punchcard 029 (1928)Constraint becomes authority. Manila stock, hairline grid, industrial blue.
 ISO Technical DrawingEvery line carries meaning. Near-black ruled geometry grades weight on cool t…