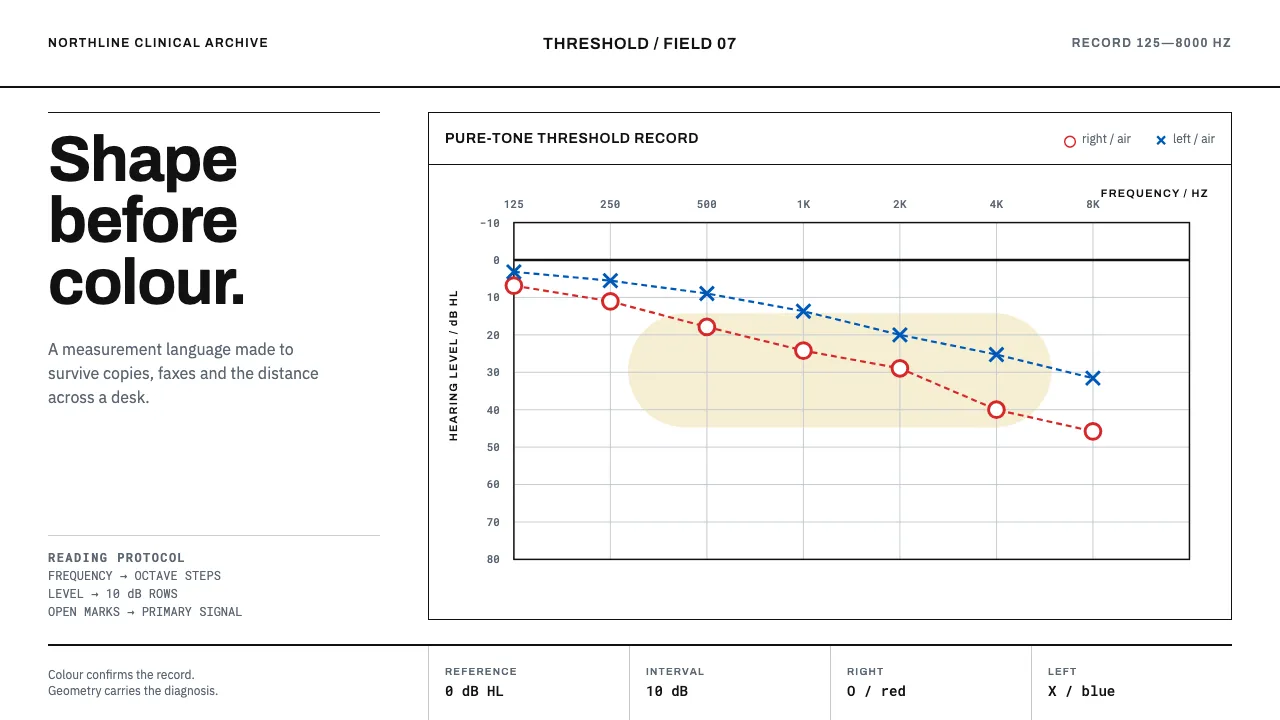
About Audiogram Chart
An audiogram is not a chart style, it is a form. Frequency in hertz runs across the top on octave steps, hearing level in decibels runs downward on the side, and both ears are plotted on the same grid: right ear a red O, left ear a blue X, bone conduction in brackets that face the reader like ears.
The discipline worth stealing is the redundancy. Shape carries the meaning; colour only confirms it. The whole form still reads after a bad photocopy, which is why nothing here is filled, glossy, or dependent on hue alone.
- Origin
- Global — ASHA/ISO-aligned clinical documentation
- Era
- 1950–1990, when pure-tone audiometry and the standard threshold form became routine clinical practice
- Key figures
- Harvey Fletcher · Georg von Békésy
- Movements
- Clinical audiology · Psychoacoustics · Standardised medical record forms
Audiogram Chart design spec
Colors
Typography
The other 11 sections — buttons, cards, spacing, motion, techniques and more — open once you unlock. Download the DESIGN.md or send it to your AI in one click. Unlock once, yours forever.
Sign up nowStyles similar to Audiogram Chart
Also inspired by science & nature, with a close feel.
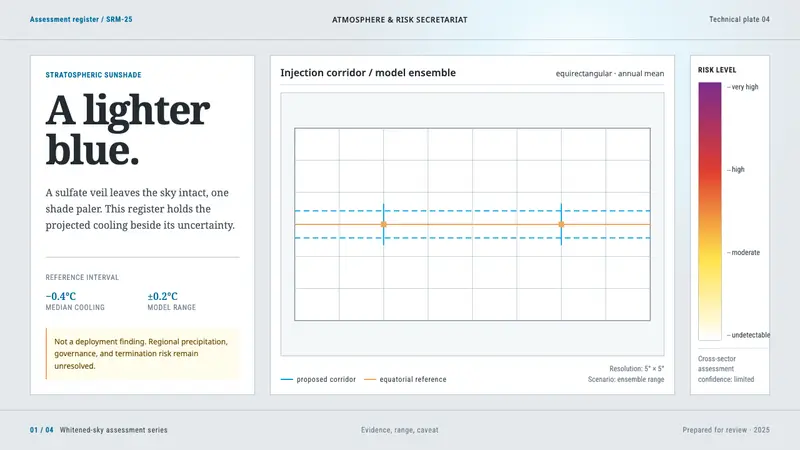 Stratospheric SunshadeUncertainty is the message. Pale sky stock, UN blue corridors, and an IPCC risk ramp hold the record.
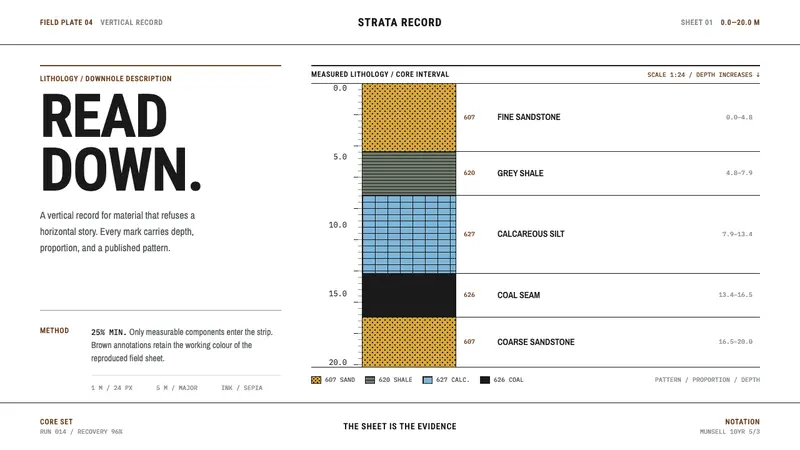 Core Sample LogRead the ground downward. Sepia rules and FGDC black patterns turn depth into evidence.
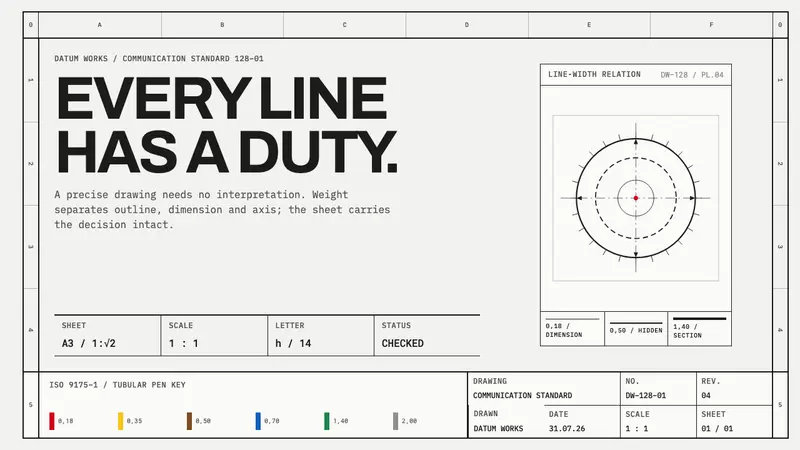 ISO Technical DrawingEvery line carries meaning. Near-black ruled geometry grades weight on cool tracing stock.
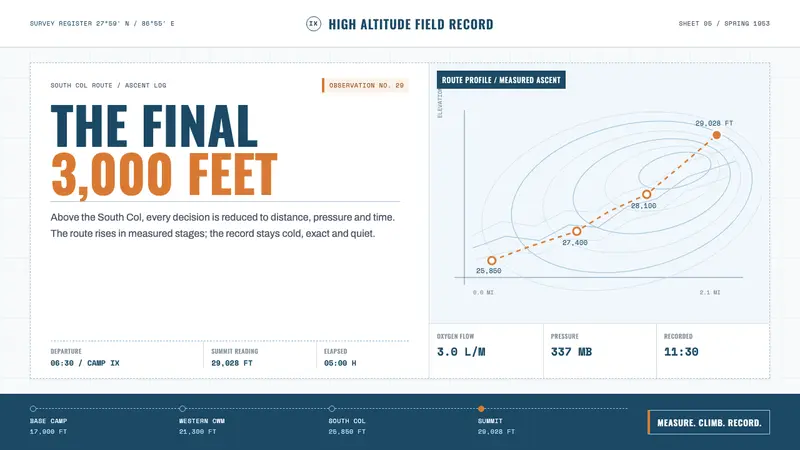 Everest Expedition (1953)Quiet heroism, precisely measured. Ice-blue contours and mono data cross a snow-white field.