What is Ushahidi Crisis Map?
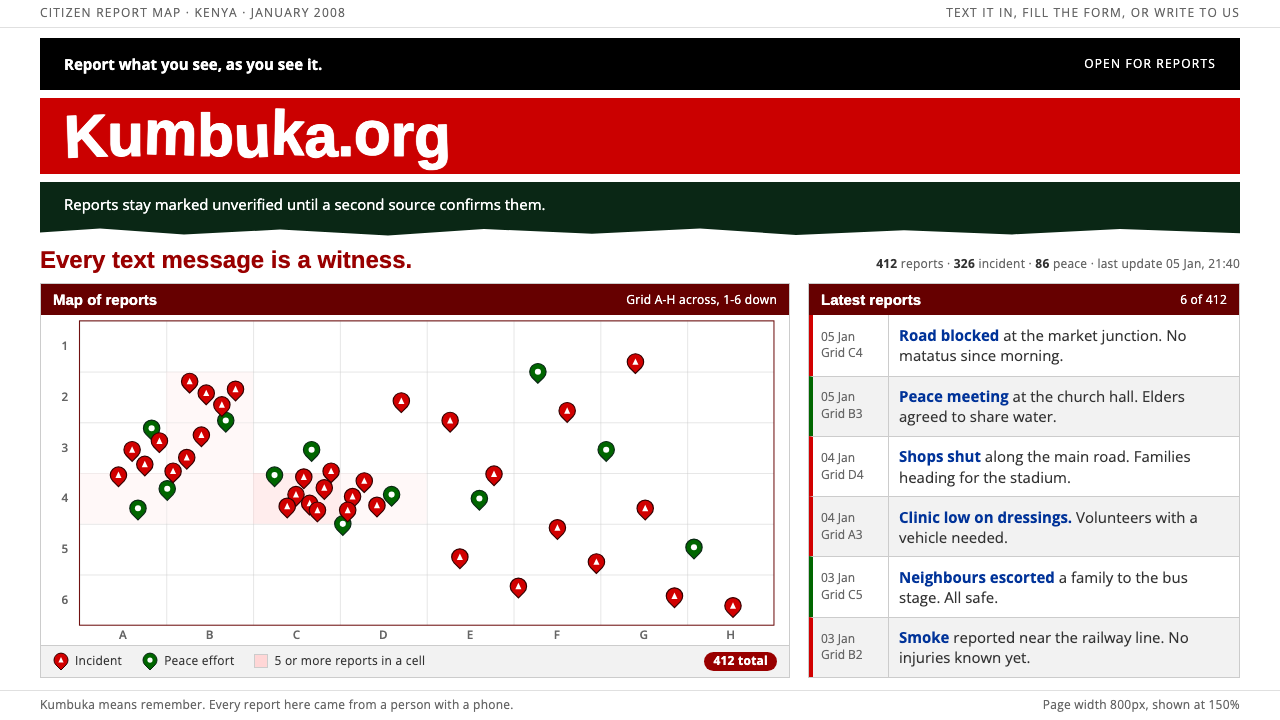
Ushahidi Crisis Map puts testimony before polish: a painted flag banner over white, red and green pins in a hairline table, and small plain type.
Ushahidi Crisis Map in brief
Ushahidi Crisis Map is a design language that deliberately looks rushed, because the thing it recreates was rushed. Ushahidi means testimony in Swahili, and the original website was built in January 2008, only days into the post-election violence in Kenya, by a small group of Kenyan bloggers and developers who wanted anyone with a phone to be able to text a report onto a public map.
The visual recipe is the plain web of the time. The page sits on the browser's default white, with a fixed-width table centered in the window. At the top is a hand-painted Kenyan flag banner with wobbly stencil lettering. Below it, a map carries two kinds of pin: dark red for reports of violence and deep green for reports of peace and mediation. Body copy is small Verdana, set in simple lists and tables with thin lines.
The style values the content of the reports over the frame around them. There is almost no decoration, no brand polish, and no attempt to look professional. That roughness is the point: it signals that the people who made it cared about whether reports were arriving, not whether the page looked good. The result is an unusually honest aesthetic, a design that tells you what it was for.

Where does Ushahidi Crisis Map come from?
The source for this system is the original ushahidi.com launch build of January to February 2008, in Nairobi. Kenya had just held a disputed presidential election in late December 2007, and violence followed. Mainstream media coverage was limited, and information moved through text messages, blogs and word of mouth. In that moment, a few people with web skills saw that scattered reports could be gathered, verified and plotted so that patterns became visible.
The people behind the first build are well known in the technology and civic communities of East Africa. Ory Okolloh, a Kenyan lawyer and blogger, had been collecting reports of the violence on her blog and publicly asked whether someone could build a way to map them. Erik Hersman, a technologist and blogger, and Juliana Rotich and David Kobia, both developers, were among those who answered. Within days they had a working site that accepted reports from the public and displayed them on a map. The speed of that response is part of what the design records.
The approach came to be known as crisis mapping, a practice built on SMS-based citizen reporting and open-source civic technology. Instead of waiting for official sources, ordinary people supplied observations and the map made them legible. The software was later released as an open-source platform that others could deploy elsewhere, and the name Ushahidi became associated with a style of civic technology that is collaborative, low-cost and willing to work in public before it is perfect.
The look reflects the conditions of that moment. The page is built from a plain table because tables were the fastest layout tool available. The homemade flag banner was something a developer could do in an evening. The fonts are those already on most computers, and the colors are limited to what the map needs: red, green and white. Later versions of the project became more polished, but this system preserves the first build, where a lack of resources produced a style that is now readable as a statement about priorities.
What defines the Ushahidi Crisis Map look?
Browser-default white
The page ground is the plain white a browser provides when nothing has been styled. There is no tint, texture or gradient. This is both a practical record of how the first build looked and a statement that the content, not the container, is meant to carry weight.
Centered fixed-width table
The layout is a single table of fixed width, centered in the window, with thin visible borders between cells. It does not respond to screen size and makes no attempt to look modern. The rigid grid gives reports a structured place to land and hints at the era of table-based web design.
Painted flag banner
A hand-painted banner in the colors of the Kenyan flag runs across the top, with stenciled white lettering that is slightly uneven. It is the only expressive element on the page. It tells you whose country this is and that people, not a corporation, made it.
Red and green pins
Map markers use two meaningful colors: a dark red for incidents of violence and a deep green for peace and mediation. The colors are sober, not bright, and carry moral weight without needing a legend longer than a line. They are the system's emotional center.
Small plain type
Body text is a small, widely available sans-serif such as Verdana, set in modest sizes with default spacing. Headings are not dramatized. The small type makes the page feel like a working document or a bulletin board, and allows many reports to appear at once.
Report lists as content
Below the map, reports are listed in simple rows with title, date and location. Each row is a testimony and is presented without ornament. Filters and categories exist, but they are plain links, not styled controls.

Who shaped Ushahidi Crisis Map?
Kenyan lawyer and blogger whose public call to map reports of the violence helped set the project in motion.
Technologist and blogger who was among the founding group that built the first Ushahidi site in Nairobi.
Kenyan developer and part of the early team behind the platform and its open-source approach.
Developer who helped write the software behind the first working version of the crisis map.
How do you use Ushahidi Crisis Map today?
For slides, this style suits talks about civic technology, humanitarian response, journalism and open data. A cover can be a white page with a roughly painted banner and a title in plain type. Content slides work as simple tables and lists with thin lines. Data slides should use red and green sparingly as category markers, with small, readable text, so the audience feels they are looking at real records rather than a polished infographic.
For web and app interfaces, it fits reporting tools, community maps, incident trackers, citizen science projects, mutual-aid boards and any product where the contributions of many people are the main content. A map with two or three pin types, a list of submissions in a table, and a simple form are enough. The interface should stay plain and fast-loading, and should resist the temptation to add decoration that would suggest a corporation is speaking.
For editorial and marketing work, it works well for documentary features, nonprofit reports, anniversary retrospectives and pieces about early internet activism. The deliberate roughness lends authenticity. Use a short banner at the top, a few columns of small type, and the occasional pin graphic. Keep photography documentary and uncropped, and let the titles be direct and factual.
A common mistake is to polish it. Rounded cards, soft shadows, a modern type scale and brand gradients turn it into a generic dashboard and erase the point. The opposite mistake is parody: exaggerating the roughness into a joke disrespects the seriousness of the subject. The right balance is plain and sincere, where the structure is simple, the colors are limited to what the content needs, and every element earns its place.

Ushahidi Crisis Map — FAQ
What does Ushahidi mean?
It is a Swahili word meaning testimony. The platform was named for its purpose: letting people submit their own reports of events and see them gathered together on a public map.
When and where was the original site built?
It was built in Nairobi, Kenya in January 2008, within days of the violence that followed the disputed election, by a small group of Kenyan bloggers and developers.
Why does the design look so plain?
Because it recreates a build that was made in a hurry, with the default white background, a simple table layout and common fonts. The plainness reflects priorities: receiving reports mattered more than appearance.
What do the red and green pins mean?
In this system, dark red marks reports of violence and deep green marks reports of peace and mediation. The two colors let readers see the balance of events on the map at a glance.
Which projects suit this style?
Community maps, incident and reporting tools, civic technology and nonprofit presentations, documentary features, and any product where the testimony of many people is the content and polish would get in the way.
Related design styles
 Lebanese Film PosterMelodrama at full volume. Lurid crimson and hot yellow on marquee black, slab…
 Mexican Lotería Folk CardLiving folk ritual. Cream cards, red borders, and saffron caption bands make…
 Plains Ledger DrawingThe grid bears witness. Pencil-muted figures and hard outlines cross aged blu…
 Slate Blackboard ChalkDust teaches. Blackboard green carries chalk script, pale smears, and boxed d…
 Persepolis (Marjane Satrapi, 2000)Stark memory, pure ink. Cream panels, heavy black borders, one revolution-red…
 Polish Solidarity Stadium GraphicDefiance fills the stands. Stadium red, Anton stencil type, and chalk-white b…