What is Titan Lake Explorer?
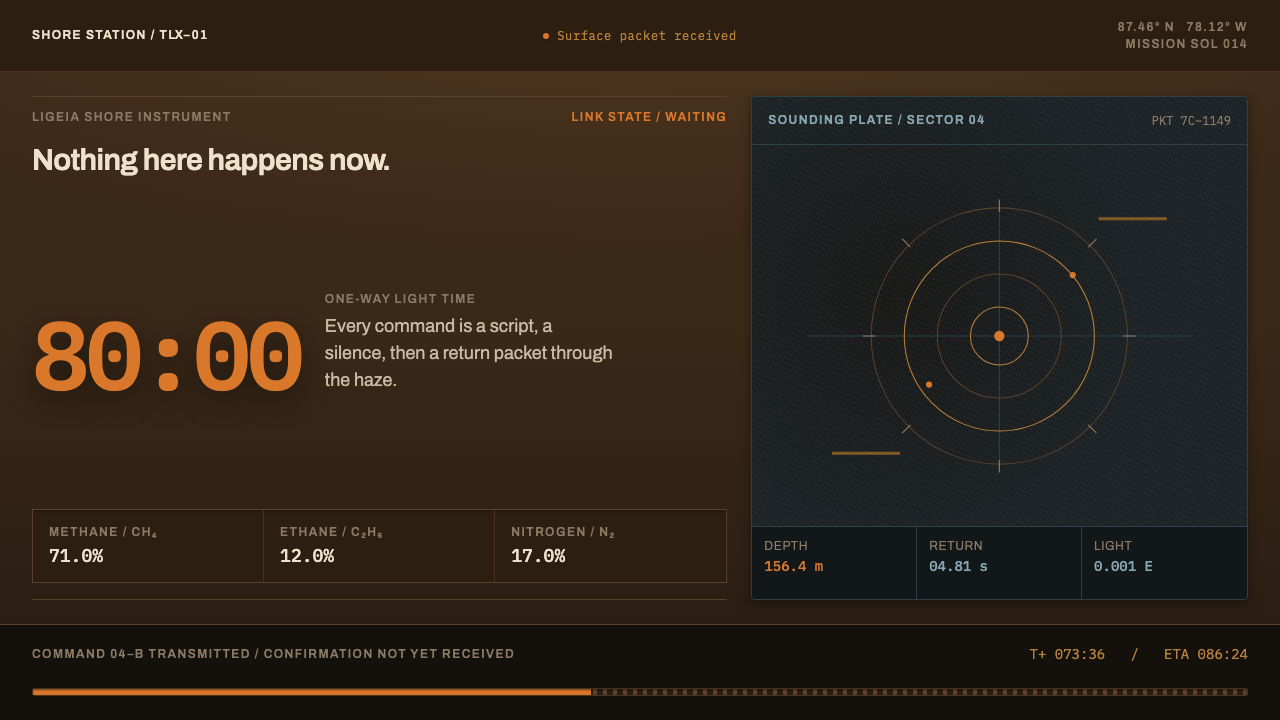
Titan Lake Explorer is a dark instrument-panel style built for a dim orange shoreline some eighty light-minutes from Earth — and for an interface honest enough to show the delay.
Titan Lake Explorer in brief
Titan Lake Explorer is a dark, low-light design language drawn from the surface of Saturn's largest moon. Its raw material is what the Huygens probe saw in 2005 and what the Cassini orbiter later measured of the northern methane seas: a brown, soft-edged, dimly lit world under a haze that goes all the way to the ground. It dresses an instrument, not a planet: the housing of a probe standing at the edge of a lake.
Two ideas hold the style together. The first is that everything arrives dim. Daylight on Titan is a tiny fraction of daylight on Earth, and the haze absorbs the short wavelengths, so the page is built from deep browns and near-blacks with very little glare. The second is that distance is a visible fact. A single orange hue, the color of the haze's own light, is the only thing that glows, and it is saved for live data that truly matters.
The layout is that of a field instrument: dark panels divided by fine ruled lines into measuring fields, with readings placed in them like entries in a logbook. Above all, a delay indicator is present on every screen. The interface never pretends that a command is instant, and it makes the wait part of the design rather than something to hide behind a spinner.

Where does Titan Lake Explorer come from?
On 14 January 2005, the European Space Agency's Huygens probe passed through Titan's thick orange haze and reached the surface. It returned a scene nobody had drawn in advance: a dark plain of rounded water-ice pebbles, smoothed by flowing liquid methane, lying under an orange photochemical haze that reaches all the way down to the ground. Daylight there is about a thousandth of what Earth receives, and the haze consumes the short wavelengths, so everything arrives brown, soft-edged and dim. That first view is the palette and the mood of this system.
Huygens was carried to Saturn by the Cassini orbiter, and the joint Cassini–Huygens mission ran from 2004 to 2017. During those years Cassini's radar and infrared instruments penetrated the haze and mapped the moon's surface, revealing lakes and seas of liquid hydrocarbons at high northern latitudes, among them Ligeia Mare and Kraken Mare. Ligeia Mare is roughly 71% methane, 12% ethane and 17% nitrogen, and it reads black to both radar and camera: a smooth liquid surface returns almost nothing, so the sea shows up as a void on the map. That blackness is a central visual fact of the style.
The second origin is not an object but a condition. One-way light time between Earth and Titan is close to eighty minutes, so a command and its confirmation are an hour and forty minutes apart. Operating a machine under that delay has its own culture: commands are sent in advance, status is reported rather than watched, and the operator lives with a gap between intention and evidence. The interface therefore says so, on every screen, all the time, in the form of a delay bar that will not go away.
This system is deliberately not the familiar picture of Titan from orbit, the butterscotch-colored globe. It dresses the instrument standing on the shore. Its era reaches from the Cassini–Huygens years into near-future lake-mission speculation, a lake explorer that is imagined but built on real measurements. The design draws on three practices: robotic in-situ exploration, low-light planetary imaging, and high-latency mission operations. Together they supply what the page needs: a dim image, a field of readings, and an honest clock.
What defines the Titan Lake Explorer look?
Haze Orange
One orange hue stands for the light of the haze, and it is the only luminous color in the system. It marks live data, the current reading, the active channel and the next event, nothing more. Because everything else is dim, a small patch of orange carries the weight a large accent block would in a bright design. Spreading it across headings or decoration would turn the one honest signal into noise.
Brown-Black Ground
The ground is a deep, warm brown-black, not a clean neutral black. It echoes a landscape in which short wavelengths have been eaten and everything is tinted toward the warm end. Panels differ from the ground by small steps in value rather than by borders and shadows, so the interface feels like looking at instruments in poor light instead of at a glossy screen.
Ruled Instrument Fields
Fine, quiet rules divide the dark surface into measuring fields, like the ruled pages of a field logbook or the graticule of an instrument display. Each field holds one kind of information, such as a reading, a trace or a status line. The rules are thin and low in contrast, so they organize without announcing themselves, and the eye reads the fields as a grid of observations.
The Delay Bar
A latency indicator is permanently present, showing one-way light time and the combined wait between a command and its confirmation. It is not a footer detail but a structural element of every screen. Commands appear in states such as queued, in flight and confirmed, each drawn with its own position along the delay, so the user always sees where an instruction is in time.
Soft Edges, Low Contrast
Because haze scatters and absorbs light, edges in this world arrive soft and contrast stays low. The style reflects that: shapes are not razor-cut against their surroundings, mid-tones are dense, and there are no harsh highlights. Legibility comes from careful value separation between text and ground, never from glare, so long sessions of reading data remain comfortable.
Black Liquid
The lake itself is drawn as a dark void, matching how a methane sea looks to radar and to the camera. Maps and charts treat liquid as an absence into which readings are inserted, with orange traces or markers floating over fields of near-black. This gives the style its sense of depth without any gradient, bloom or simulated reflection.

Who shaped Titan Lake Explorer?
The team behind Huygens' Descent Imager and Spectral Radiometer is credited in the source as a key figure for this style. Their instrument produced the view from the surface and the descent: the pebbled plain and the orange murk nobody had drawn beforehand. The soft-edged brown tonality of this theme is, in effect, their picture of how Titan's light behaves close to the ground.
The Cassini RADAR team looked through the haze with microwaves and mapped Titan's surface, including the dark seas of the north. Their finding that liquid surfaces return almost no signal is why lakes appear as voids in this style. The theme's black panels, with data traced over them, are a direct visual translation of what radar shows: emptiness that is full of meaning.
The Visual and Infrared Mapping Spectrometer team worked at wavelengths where the haze can be seen through, studying the surface and atmosphere of Titan as a material world. Their presence in the source stands for the infrared view of the moon: warmer, softer and far from the clean photograph. It supports the style's insistence on low contrast and its restraint in the use of color.
How do you use Titan Lake Explorer today?
Titan Lake Explorer works wherever the product is about remote, delayed or uncertain information, and where the user benefits from being told honestly how stale a reading is. Its dimness is a feature: it suits long sessions, monitoring work and contemplative interfaces. It is least suited to cheerful consumer products that rely on bright, high-energy color.
For presentation slides, use a deep brown-black cover with a title in pale text, one orange marker, and a thin delay bar running along the bottom edge as a recurring motif. Content slides become instrument fields: a reading, a short label and a rule, repeated in a calm grid. Data slides are a natural fit; time-series traces can float in orange over dark fields, and a delay bar can show which values are current and which are in transit.
For web interfaces, the style fits monitoring dashboards, remote-device and fleet consoles, deployment pipelines, trading-style status boards, scientific data tools and any system with eventual consistency, where the page should tell the user when information was true. Keep surfaces dark and low in contrast, group data into ruled fields, and reserve orange for live values and the active command. Show pending states as visible positions on a timeline, not as generic loading animations.
For editorial and marketing work, it is well suited to science and space journalism, long-form essays about exploration, and product stories about reliability under difficult conditions. Use photographs or illustrations with soft edges and warm dim tones, set text in a narrow column, and let a single orange accent mark the key figure or caption. Marketing for infrastructure and observability products can borrow the honesty of the delay bar as a message in itself.
A common mistake is to treat orange as a brand accent and put it on buttons, headings and icons. Once everything glows, nothing is live, and the premise is lost. A second mistake is to add stars, planetary glows or lens flares to make it feel cosmic; the surface of Titan is murky, not glittering. A third is to include the delay bar on the cover and drop it from working screens, which makes the interface dishonest in exactly the place where it matters.

Titan Lake Explorer — FAQ
Is Titan's surface really orange?
Not quite. The orange belongs to the haze, which hangs all the way down to the ground. The surface itself, as Huygens showed, is a dark plain of rounded ice pebbles, and because so little light arrives and the haze eats the short wavelengths, everything looks brown, soft-edged and dim. That is why the style uses a brown-black ground and keeps orange as the haze's light, reserved for live data.
Why does the interface always show a delay bar?
Because one-way light time to Titan is close to eighty minutes, so a command and its confirmation are about an hour and forty minutes apart. Pretending otherwise would misrepresent the system. The delay bar turns that fact into part of the design: it tells the user how old a reading is and how long an instruction must wait. In products on Earth, the same device can express network lag, sync status or batch processing.
Is this a science-fiction style?
It is rooted in real measurements rather than genre conventions. The Huygens landing, the Cassini radar and infrared observations and the composition of Ligeia Mare are all documented. What is imagined is the lake explorer itself, which belongs to near-future mission speculation. The result looks like an engineering instrument, and avoids glowing holograms, lens flares and other familiar science-fiction effects.
Can I use it with a light background?
It is designed as a dark system, because dimness is its subject. A light inversion would remove the logic of the single glowing orange and make the instrument fields look like an ordinary spreadsheet. If a light surface is unavoidable, such as a print handout, keep the brown tonality, the ruled fields and the delay bar, and let the orange appear only as a small marker.
What kinds of products suit it best?
Anything where information travels, ages or arrives with uncertainty: remote monitoring, device fleets, scientific tools, logistics tracking, observability platforms and long-session analytical software. It also fits editorial work on exploration and space. It is a weaker match for impulse-driven retail or playful apps, where a calm, dim interface would underplay the energy those products want.
Related design styles
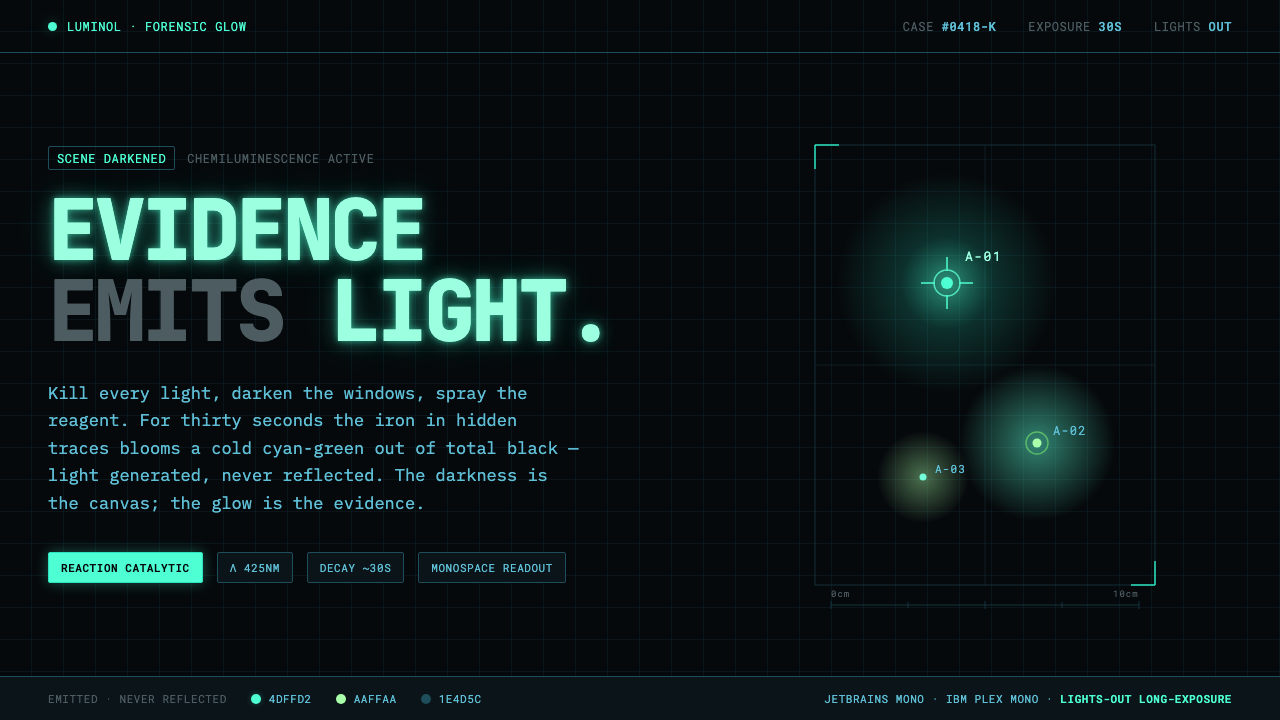 Luminol CSI GlowEvidence emits its own light. Cold cyan-green glow bloomed from pitch-black,…
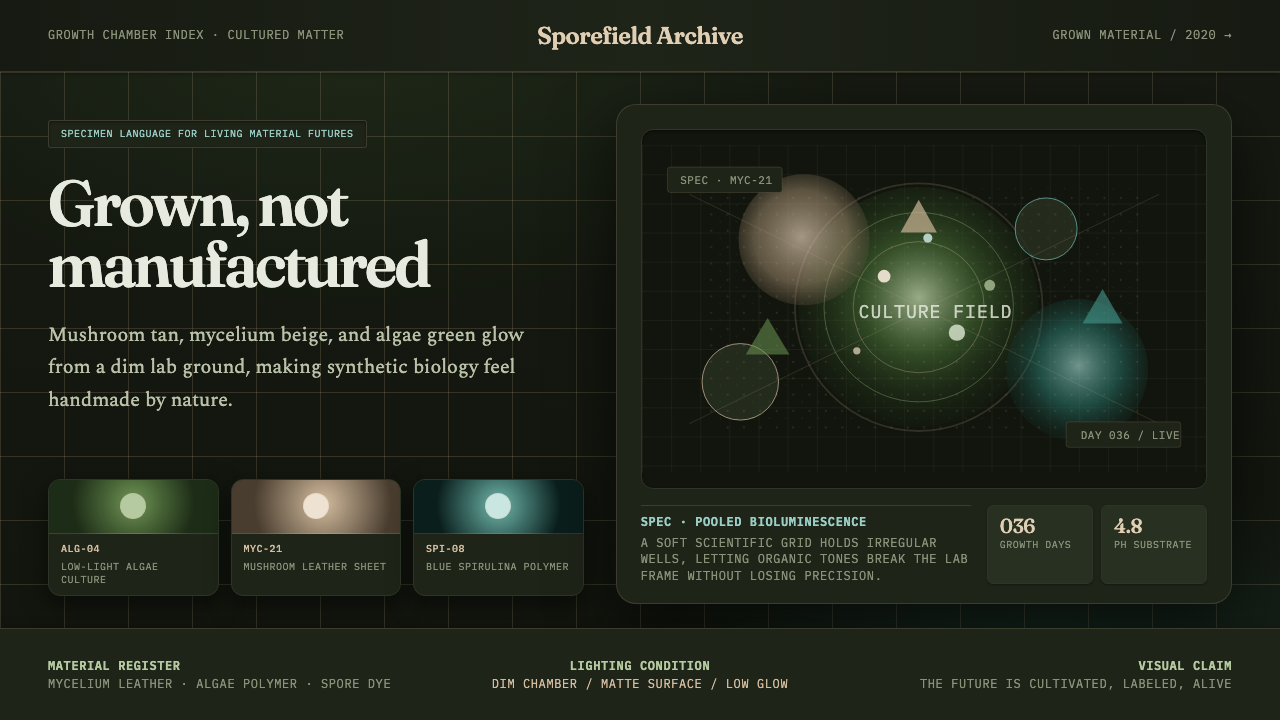 Biopunk GrownLife replaces industry. Algae green glows on chamber dark with serif voice an…
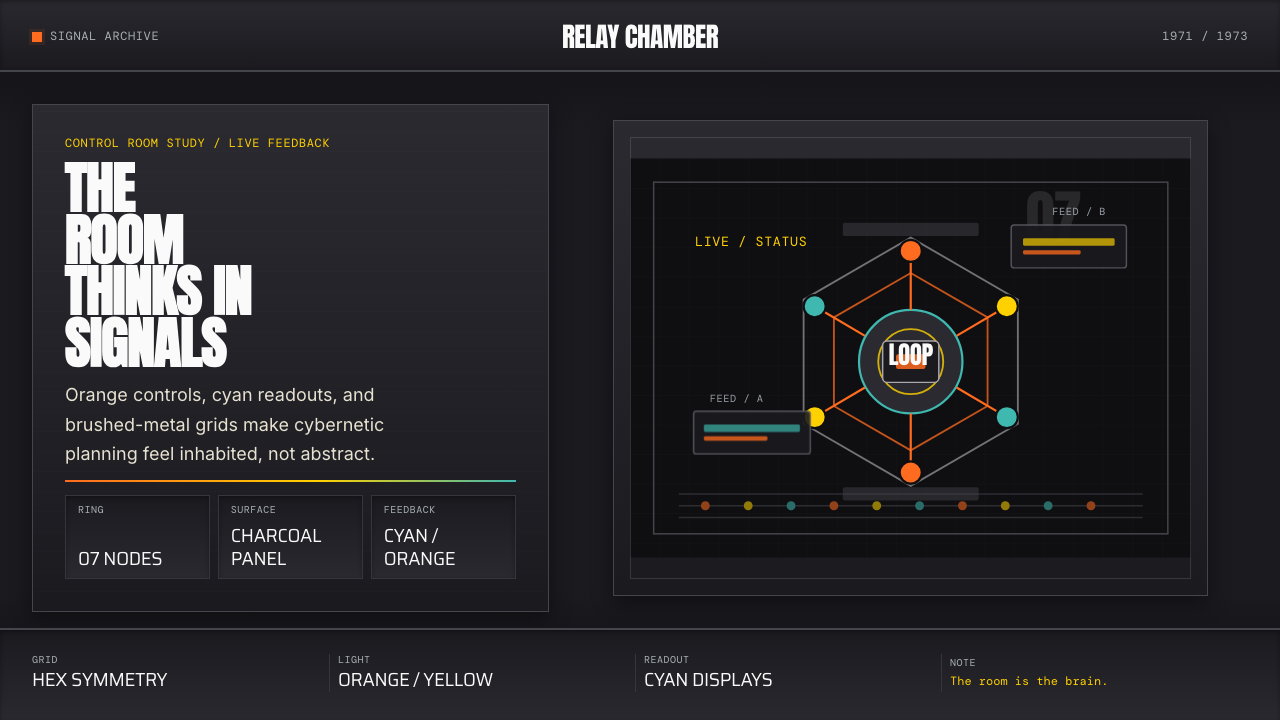 Cybernetic 1968 (Stafford Beer)Mission-control severity. Charcoal panels, orange buttons, cyan readouts, hex…
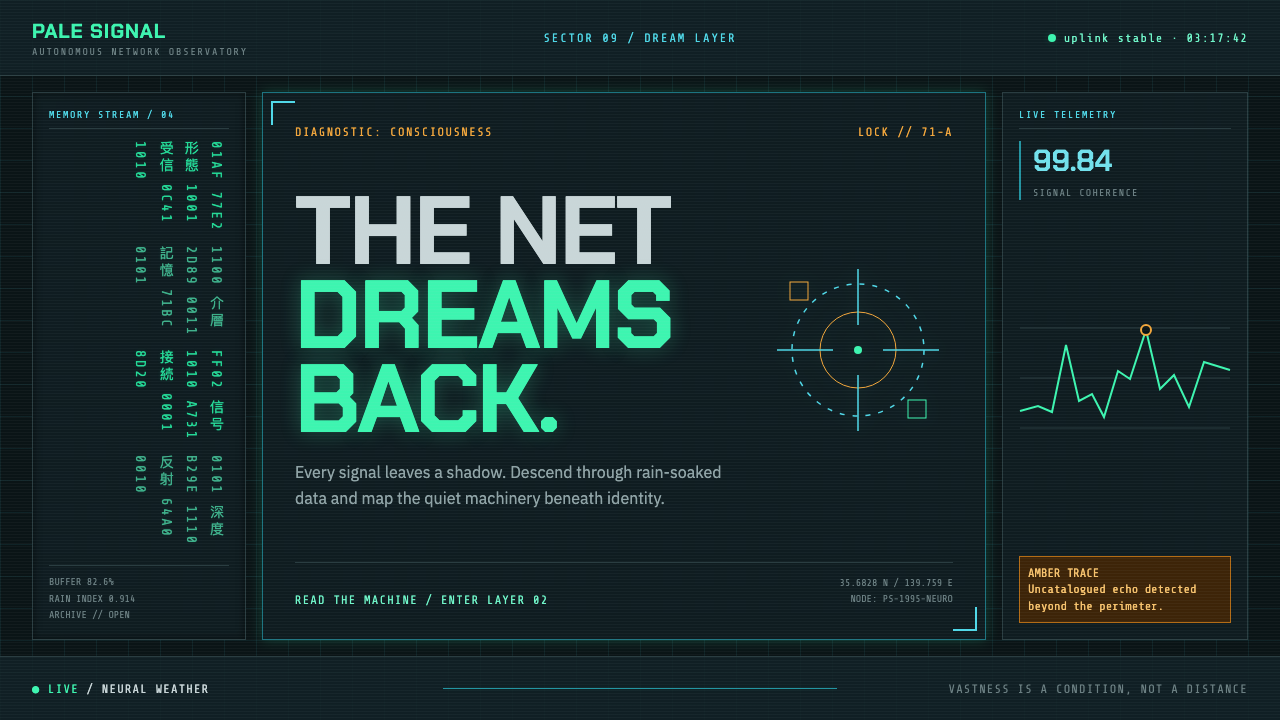 Ghost in the Shell (1995)A machine dreams in the rain. Phosphor green code burns through black-teal gl…
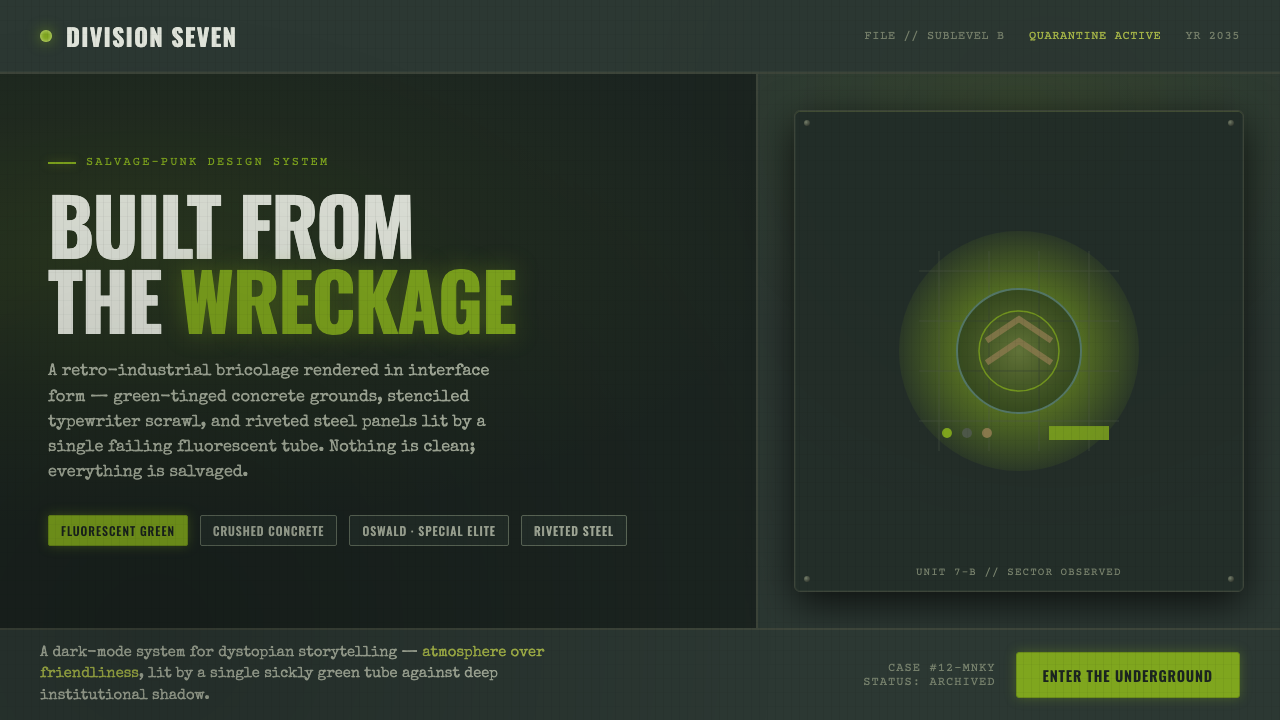 12 MonkeysBuilt from the wreckage. Sickly fluorescent green on crushed-black concrete,…
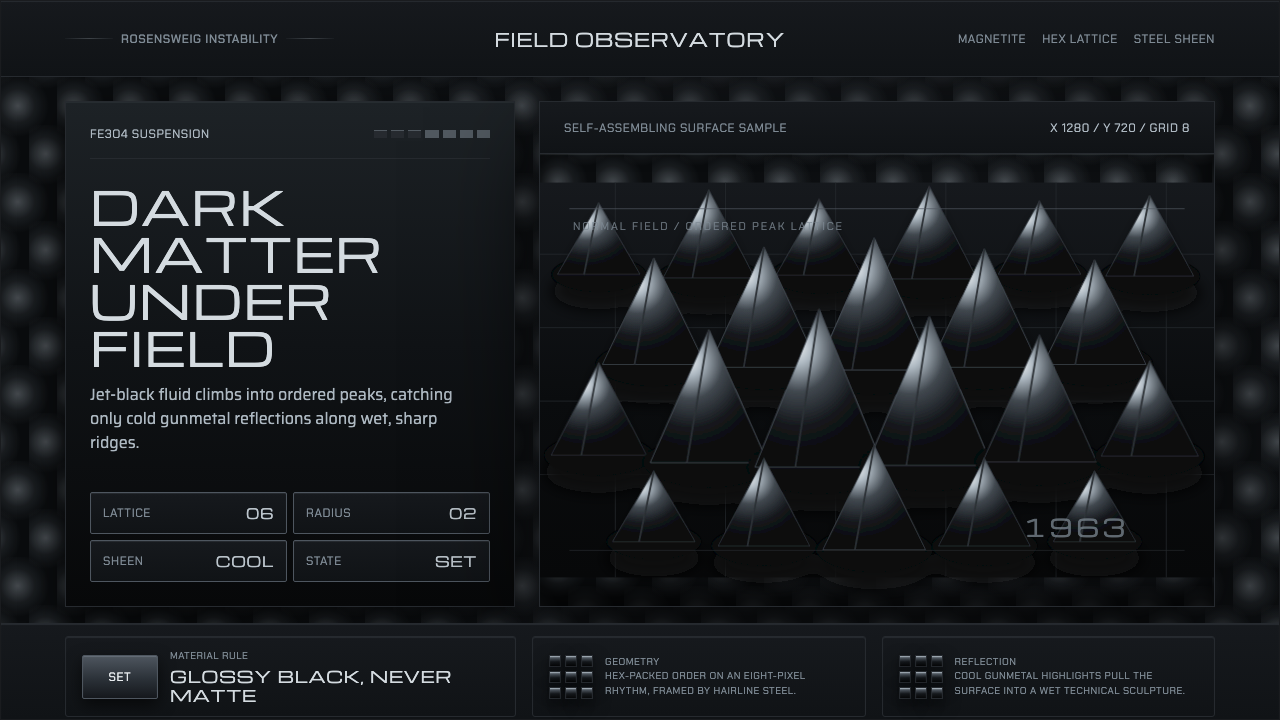 Ferrofluid Spike FieldPhysics turns sculptural. Jet black peaks, steel sheen, hex order.