What is Tableau (Business Intelligence)?什么是 Tableau (Business Intelligence)?
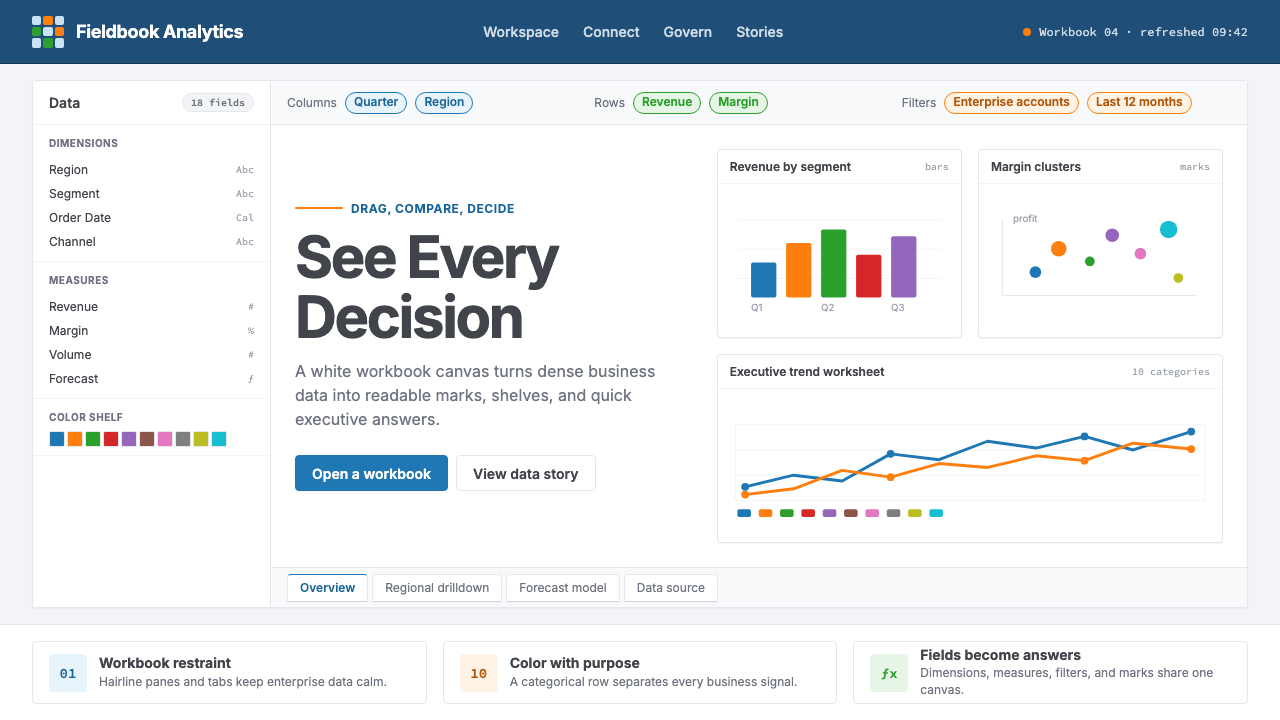
Tableau turned academic research on visual query languages into the defining aesthetic of enterprise analytics — a workbook of navy chrome, hairline grid lines, and a ten-color palette engineered to make dense data readable at a glance.Tableau 将可视化查询语言的学术研究转化为企业级分析的标志性美学——深蓝色工作簿框架、细如发丝的网格线,以及一套专为让密集数据一目了然而设计的十色调色板。
Tableau (Business Intelligence) in briefTableau (Business Intelligence) 速览
Tableau's visual identity is, at its core, a design of productive restraint. The interface presents a white canvas surrounded by navy workbook chrome — a deep, authoritative blue that frames rather than dominates. Inside that frame, data takes center stage: marks, axes, and reference lines occupy a rigorously white field, with color reserved for categorical meaning rather than decoration. The aesthetic sits at the intersection of spreadsheet practicality and considered graphic design, and that tension is precisely the point.Tableau 的视觉语言,本质上是一种富有成效的克制设计。界面呈现一块白色画布,被深蓝色工作簿框架所环绕——这种深沉而具权威感的蓝色起到框定空间的作用,而非喧宾夺主。框架之内,数据占据中心舞台:数据标记、坐标轴与参考线占据严格的白色区域,色彩被保留用于表达分类含义,而非装饰。这种美学处于电子表格的实用性与经过思考的平面设计之间,而正是这种张力构成了其核心。
The hallmark of the Tableau visual language is its ten-color categorical palette, which has become one of the most recognizable design artifacts in enterprise software. The palette was engineered with color-blind safety in mind, spacing hues at perceptually distinct intervals so that data series remain distinguishable to the widest possible audience. Each color is saturated enough to read clearly against a white chart ground, yet desaturated enough that the palette remains calm when all ten appear simultaneously. This balance — vivid but not loud — defines the Tableau mark aesthetic.Tableau 视觉语言的标志是其十色分类调色板,已成为企业软件中最具辨识度的设计符号之一。这套调色板以色盲安全为设计前提,将色相以感知上截然不同的间隔排布,使数据序列能够被尽可能广泛的受众所区分。每种颜色的饱和度足以在白色图表底面上清晰呈现,同时又经过去饱和处理,使得十种颜色同时出现时整体仍保持平静。这种平衡——鲜明但不喧嚣——正是 Tableau 标记美学的精髓所在。
Typography in the Tableau environment is geometric and sans-serif throughout, used at comfortable reading sizes that favor clarity over personality. Labels hug data points without crowding them; axis titles are subdued to let the data values speak. The overall composition prioritizes information density: worksheets can display hundreds of data points in a compact space because the visual grammar is so tightly calibrated. Every interface element — filter shelf pills, marks cards, worksheet tabs — contributes to a vocabulary that is immediately legible to analysts while remaining approachable to non-technical viewers.Tableau 环境中的字体排印始终是几何无衬线风格,以舒适的阅读尺寸使用,优先考虑清晰度而非个性。标签紧贴数据点而不拥挤;坐标轴标题刻意低调,让数据值本身发声。整体构图优先考虑信息密度:工作表可以在紧凑的空间内显示数百个数据点,因为视觉语法经过如此精密的校准。每一个界面元素——筛选器药丸、标记卡片、工作表标签——共同构成一套词汇体系,对分析师而言即时可读,对非技术用户而言也保持亲和。
See the Tableau (Business Intelligence) design system查看 Tableau (Business Intelligence) 完整设计系统
Where does Tableau (Business Intelligence) come from?Tableau (Business Intelligence) 从何而来?
Tableau's story begins not in a corporate design studio but in a Stanford University computer science laboratory in the late 1990s. Pat Hanrahan, a professor who had previously won an Academy Award for his computer graphics work at Pixar, was conducting research on visual query languages — ways of letting users interact with databases through pictures rather than SQL syntax. His doctoral student Chris Stolte developed VizQL (Visual Query Language), a system that automatically translated drag-and-drop interactions into database queries and rendered the results as appropriate chart types. This academic work formed the technical and aesthetic foundation of everything Tableau would become.Tableau 的故事并非起源于某个企业设计工作室,而是在1990年代末斯坦福大学的计算机科学实验室。Pat Hanrahan 教授此前曾因在皮克斯的计算机图形学工作而获得奥斯卡奖,他当时正在研究可视化查询语言——一种让用户通过图形而非 SQL 语法与数据库交互的方式。他的博士生 Chris Stolte 开发了 VizQL(可视化查询语言),这个系统能够自动将拖放操作转化为数据库查询,并将结果渲染为合适的图表类型。这项学术研究构成了 Tableau 一切后续发展的技术与美学基础。
In 2003, Hanrahan, Stolte, and business school graduate Christian Chabot co-founded Tableau Software in Seattle, Washington. The founding insight was commercial as much as technical: the tools that analysts were using — primarily Excel pivot tables — were powerful but created friction between a question and its visual answer. Tableau's interface, built on VizQL, was designed to reduce that friction to near zero. The drag-and-drop workbook metaphor was not accidental; it borrowed the visual grammar of spreadsheet applications that analysts already understood, then replaced the cell-filling labor with instantaneous chart rendering.2003年,Hanrahan、Stolte 与商学院毕业生 Christian Chabot 在华盛顿州西雅图联合创立了 Tableau Software。创始洞察既是技术性的也是商业性的:分析师当时使用的工具——主要是 Excel 数据透视表——虽然功能强大,但在问题与其可视化答案之间制造了大量摩擦。基于 VizQL 构建的 Tableau 界面旨在将这种摩擦降至接近于零。拖放式工作簿隐喻并非偶然——它借用了分析师已经熟悉的电子表格应用的视觉语法,然后用即时图表渲染取代了繁琐的单元格填写工作。
The early visual identity reflected the product's positioning as an enterprise tool that valued clarity and authority. Navy blue, which carries associations with corporate professionalism and trustworthiness across many cultures, anchored the interface chrome. The white chart canvas maximized contrast for data marks. The categorical color palette — developed and refined through multiple versions — became a signature that users recognized across screenshots, conference slides, and shared dashboards. By the time Tableau went public in 2013, its visual language had become a de facto standard for what enterprise analytics software was expected to look like.早期视觉形象反映了产品作为企业工具的定位,重视清晰度与权威感。深蓝色在许多文化中具有企业专业性与可信赖性的联想,为界面框架奠定了基调。白色图表画布最大化了数据标记的对比度。经过多个版本开发与完善的分类色板,成为用户在截图、会议幻灯片与共享仪表板中一眼即识的标志。到 Tableau 于2013年上市时,其视觉语言已成为企业分析软件预期外观的事实标准。
In 2019, Salesforce acquired Tableau for approximately fifteen point seven billion dollars, making it one of the largest acquisitions in enterprise software history. The post-acquisition period brought gradual integration with Salesforce's broader design system while largely preserving the core Tableau visual vocabulary that users had internalized. Mark Nelson, who became CEO after the acquisition, oversaw a period of product evolution that expanded Tableau's capabilities — Tableau Public, Tableau Prep, Tableau Cloud — while maintaining the workbook-and-canvas aesthetic as the unifying visual framework. Today the Tableau style is recognized globally as the canonical language of visual business intelligence.2019年,Salesforce 以约157亿美元收购 Tableau,成为企业软件史上规模最大的收购之一。收购后,Tableau 逐步与 Salesforce 更广泛的设计系统融合,同时在很大程度上保留了用户已经内化的核心 Tableau 视觉词汇。收购后出任 CEO 的 Mark Nelson 主导了产品演进时期,将 Tableau 的能力扩展至 Tableau Public、Tableau Prep、Tableau Cloud 等产品线,同时将工作簿与画布的美学维持为统一的视觉框架。如今,Tableau 风格已被全球公认为可视化商业智能的标准视觉语言。
What defines the Tableau (Business Intelligence) look?Tableau (Business Intelligence) 的视觉特征是什么?
Navy Chrome and White Canvas深蓝框架与白色画布
The most immediately recognizable feature of the Tableau aesthetic is its two-zone composition: a deep navy blue surrounds the interface controls — toolbars, shelves, sidebars — while the chart canvas itself is kept pure white. The navy carries authority without being aggressive; it recedes visually so that the data on the white field advances. This contrast is fundamental to the visual grammar. No other color competes for the structural role that navy plays in framing the analytical workspace.Tableau 美学最直接可辨的特征,是其双区构图:深海蓝色围绕界面控件——工具栏、数据架、侧边栏——而图表画布本身保持纯白。深蓝色传达权威而不咄咄逼人;它在视觉上退隐,使白色区域上的数据向前推进。这种对比是视觉语法的基础。没有任何其他颜色能与深蓝色在框定分析工作区方面所扮演的结构角色相竞争。
Ten-Color Categorical Palette十色分类调色板
Tableau's standard categorical palette contains exactly ten distinct hues, spaced at perceptually even intervals around the color wheel and calibrated for color-blind accessibility. The palette is the most copied design element in the business intelligence industry — competitors and imitators have produced dozens of near-identical variants. Each color is saturated enough to distinguish clearly from its neighbors but restrained enough that the palette reads as a system rather than a collection of competing accent colors. When only a few categories are present, the palette uses its first colors, which lean toward blue, orange, and muted green.Tableau 的标准分类调色板恰好包含十种截然不同的色相,沿色轮以感知均匀的间隔分布,并针对色盲可及性进行了校准。这套色板是商业智能行业被复制最多的设计元素——竞争对手和模仿者已产生了数十种几乎相同的变体。每种颜色的饱和度足以与相邻色明确区分,同时又足够克制,使整套色板呈现为一个体系,而非一组相互竞争的强调色集合。当只有少数几个数据类别时,色板优先使用前几种颜色,这些颜色偏向蓝色、橙色和柔和的绿色。
Hairline Grid and Axis Lines发丝级网格与坐标轴线
Tableau charts use grid lines and axis rules that are deliberately thin and pale — nearly invisible against the white canvas but present enough to guide the eye across a chart. This restraint is a deliberate calibration: heavy grid lines compete with the data marks they are meant to support; hairline rules serve without asserting themselves. Reference lines, trend lines, and confidence bands follow the same logic — they add analytical context without adding visual noise. The result is a chart surface that feels clean even when it carries substantial information.Tableau 图表使用刻意细而浅的网格线和坐标轴线——在白色画布上几近隐形,但又足够存在以引导视线横跨图表。这种克制是有意识的校准:粗重的网格线会与它们本应支撑的数据标记相竞争;发丝级线条则在不主张自身存在感的情况下提供服务。参考线、趋势线和置信区间遵循同样的逻辑——它们增添分析背景,而不增加视觉噪音。结果是图表表面即便承载大量信息也感觉整洁。
Marks as Geometric Objects标记作为几何对象
Data points in Tableau are rendered as discrete geometric marks — circles, squares, bars, lines — that carry meaning through their position, color, size, and shape simultaneously. The marks card, a core interface element, lets users assign each of these visual channels to data fields independently. This system encodes multiple dimensions of information into a single chart without requiring additional panels or annotations. Marks are drawn cleanly, without drop shadows or gloss effects, so their geometric properties read at small sizes and across different output media.Tableau 中的数据点被渲染为离散的几何标记——圆形、正方形、条形、线条——同时通过位置、颜色、大小和形状传递意义。标记卡片作为核心界面元素,允许用户独立地将这些视觉通道分别分配给数据字段。这个系统将信息的多个维度编码进单一图表,而无需额外的面板或注释。标记被绘制得干净利落,没有投影或光泽效果,因此其几何属性在小尺寸和不同输出媒介下均能清晰呈现。
Filter Pills and Shelf Typography筛选器药丸与数据架排印
Beyond the chart canvas, Tableau has developed a distinctive interaction vocabulary in its filter shelves and control areas. Data fields appear as rounded pill-shaped chips, color-coded to indicate whether they carry discrete or continuous values. This pill grammar — small, labeled, repositionable objects that can be dragged and dropped to change the chart — is so strongly associated with Tableau that it has influenced the design of competing analytics interfaces. The typography within these elements is compact and functional, set at reading sizes optimized for density rather than display.在图表画布之外,Tableau 在其筛选器数据架和控件区域发展出了一套独特的交互词汇。数据字段以圆角药丸形状的芯片呈现,通过颜色编码指示其承载的是离散值还是连续值。这套药丸语法——小巧、带标签、可通过拖放改变图表的可重置对象——与 Tableau 的关联如此紧密,以至于它已影响了竞争对手分析界面的设计。这些元素中的字体排印紧凑而功能性,使用针对信息密度而非展示效果优化的阅读尺寸。
Dashboard Tiling and Layout Logic仪表板平铺与布局逻辑
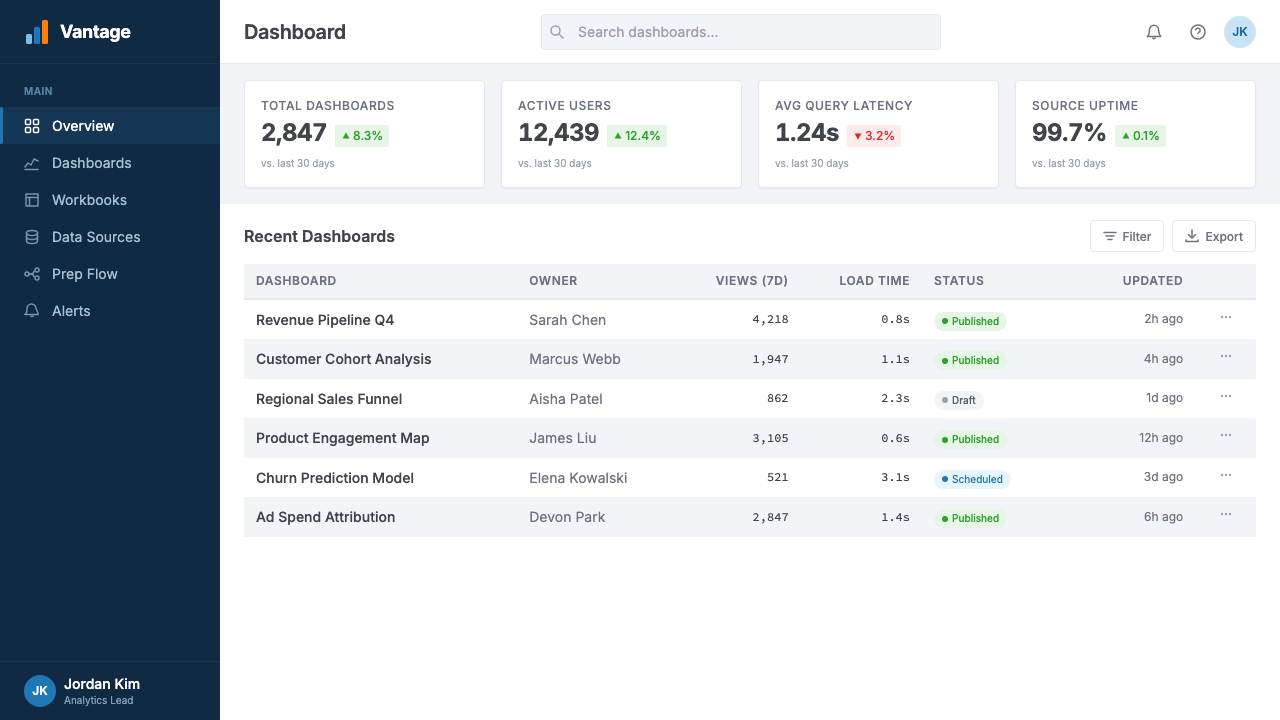
Tableau dashboards use a tiling system that divides the canvas into nested containers — horizontal and vertical zones that can be stacked and resized. This approach to layout is structural rather than freeform: elements snap into relationship with each other, creating implicit alignment and visual rhythm across the dashboard surface. The grid is never visible, but its organizing effect is felt throughout. Background rectangles in flat grays or very light tints of the brand palette serve as section dividers, keeping the composition readable without introducing color-based hierarchy.Tableau 仪表板采用平铺系统,将画布划分为嵌套容器——可以堆叠和调整大小的水平与垂直区域。这种布局方式是结构性的而非自由形态的:元素彼此对齐吸附,在仪表板表面创造隐性的对齐关系与视觉节奏。网格从不可见,但其组织效果贯穿始终。平面灰色或品牌调色板非常浅色调的背景矩形充当段落分割线,在不引入基于颜色的层级的情况下保持构图可读。
Typographic Hierarchy Through Scale通过尺度建立字体排印层级
Tableau establishes visual hierarchy almost entirely through scale and weight rather than color. Dashboard titles are set large and moderately bold; section headings step down in size; axis labels and data annotations occupy the smallest tier. This scale-based hierarchy is reinforced by consistent use of geometric sans-serif letterforms throughout — there are no decorative typefaces, no script headers, no serif contrasts. The restraint ensures that the typographic system supports data comprehension rather than competing with it for attention.Tableau 几乎完全通过尺度与字重而非颜色来建立视觉层级。仪表板标题设置得大而适度粗重;章节标题依次缩小;坐标轴标签和数据注释占据最小层级。这种基于尺度的层级通过全程一致使用几何无衬线字体形态得到强化——没有装饰性字体,没有花体标题,没有衬线对比。这种克制确保字体排印系统服务于数据理解,而不是与之争夺注意力。
See the Tableau (Business Intelligence) design system查看 Tableau (Business Intelligence) 完整设计系统
Who shaped Tableau (Business Intelligence)?谁塑造了 Tableau (Business Intelligence)?
Hanrahan is the intellectual origin of Tableau. A computer science professor at Stanford who had previously contributed to the development of RenderMan at Pixar — winning a Technical Academy Award for that work — he brought the rigor of academic computer graphics to the problem of data visualization. His research on visual query languages, conducted with Chris Stolte, produced VizQL, the engine that made Tableau's drag-and-drop interface technically possible. Hanrahan co-founded Tableau in 2003 and has remained affiliated with it through the Salesforce acquisition, serving as a guiding voice on the relationship between visual perception and data representation.Hanrahan 是 Tableau 的思想起源。这位斯坦福大学计算机科学教授此前曾参与皮克斯 RenderMan 的开发——并因此荣获奥斯卡技术奖——他将学术计算机图形学的严谨性带入了数据可视化问题。他与 Chris Stolte 共同进行的可视化查询语言研究产生了 VizQL,这一引擎使得 Tableau 拖放界面在技术上成为可能。Hanrahan 于2003年联合创立 Tableau,并在 Salesforce 收购后持续参与其中,在视觉感知与数据表达的关系上发挥着指导性作用。
Stolte was the doctoral student who translated Hanrahan's theoretical research on visual query languages into a working system. His PhD dissertation introduced VizQL and demonstrated that a visual grammar could be defined rigorously enough to serve as the basis for a commercial product. As a Tableau co-founder, Stolte shaped the core interaction model — the shelves, marks, and axes — that became the foundation of the Tableau visual vocabulary. His work drew on research into human perceptual capabilities, particularly the theory of pre-attentive attributes, to make data-to-visual mappings feel intuitive rather than arbitrary.Stolte 是将 Hanrahan 的可视化查询语言理论研究转化为实际系统的博士生。他的博士论文引入了 VizQL,并证明视觉语法可以被足够严格地定义,从而作为商业产品的基础。作为 Tableau 联合创始人,Stolte 塑造了核心交互模型——数据架、标记和坐标轴——这成为 Tableau 视觉词汇的基础。他的工作借鉴了对人类感知能力的研究,特别是前注意属性理论,使数据到视觉的映射感觉直觉而非任意。
Chabot brought the commercial vision and entrepreneurial energy that turned an academic research project into a billion-dollar software company. As Tableau's founding CEO, he shaped the product's positioning as a tool that democratized data analysis — making it accessible to business analysts who were not data scientists. Chabot's insight that the barrier to data visualization was interface friction, not analytical capability, drove the emphasis on simplicity and immediacy that defines the Tableau user experience. He led the company from its 2003 founding through its 2013 IPO and remained at the helm until the Salesforce acquisition era.Chabot 带来了商业愿景和创业活力,将一个学术研究项目转化为价值数十亿美元的软件公司。作为 Tableau 的创始 CEO,他将产品定位为使数据分析民主化的工具——让非数据科学家的业务分析师也能使用。Chabot 洞察到数据可视化的障碍在于界面摩擦而非分析能力,这推动了对简洁性和即时性的强调,而这正是 Tableau 用户体验的定义性特质。他带领公司从2003年创立走到2013年上市,并在 Salesforce 收购时期前一直掌舵。
Nelson became Tableau's CEO following the Salesforce acquisition and has overseen the product's evolution in the post-acquisition era. His leadership has navigated the tension between maintaining Tableau's distinctive visual identity and integrating it into the broader Salesforce ecosystem. Under Nelson, Tableau has expanded its product family — including Tableau Public, which made the platform accessible to non-enterprise users and created a large public library of Tableau-styled visualizations — while preserving the workbook-and-canvas design language that made the platform recognizable. His tenure represents the phase in which the Tableau aesthetic became institutionalized as a global standard.Nelson 在 Salesforce 收购后成为 Tableau 的 CEO,主导了收购后时期的产品演进。他的领导力驾驭了维护 Tableau 独特视觉形象与将其融入更广泛 Salesforce 生态系统之间的张力。在 Nelson 的带领下,Tableau 扩展了产品家族——包括使平台向非企业用户开放的 Tableau Public,创造了大量公开的 Tableau 风格可视化作品库——同时保留了使平台具有辨识度的工作簿与画布设计语言。他的任期代表着 Tableau 美学被制度化为全球标准的阶段。
How do you use Tableau (Business Intelligence) today?今天怎么用 Tableau (Business Intelligence)?
The Tableau aesthetic is most naturally at home in data-heavy contexts where information density, analytical clarity, and professional authority are the primary values. Applying it well means understanding its underlying logic: a white foreground for data, a dark structural chrome for navigation, a restrained categorical palette for meaning, and typographic scale rather than color for hierarchy. This system works because each of its components has a clear functional role. When components are borrowed without their functional logic, the result looks like business software rather than a considered design.Tableau 美学最自然地归属于信息密度、分析清晰度与专业权威感是首要价值的数据密集型场景。运用得当意味着理解其底层逻辑:白色前景用于数据展示,深色结构框架用于导航,克制的分类调色板用于传递含义,字体尺度而非颜色用于层级区分。这套系统之所以有效,是因为其每个组成部分都有明确的功能角色。当组件在脱离其功能逻辑的情况下被借用时,结果看起来像是商业软件,而非经过深思熟虑的设计。
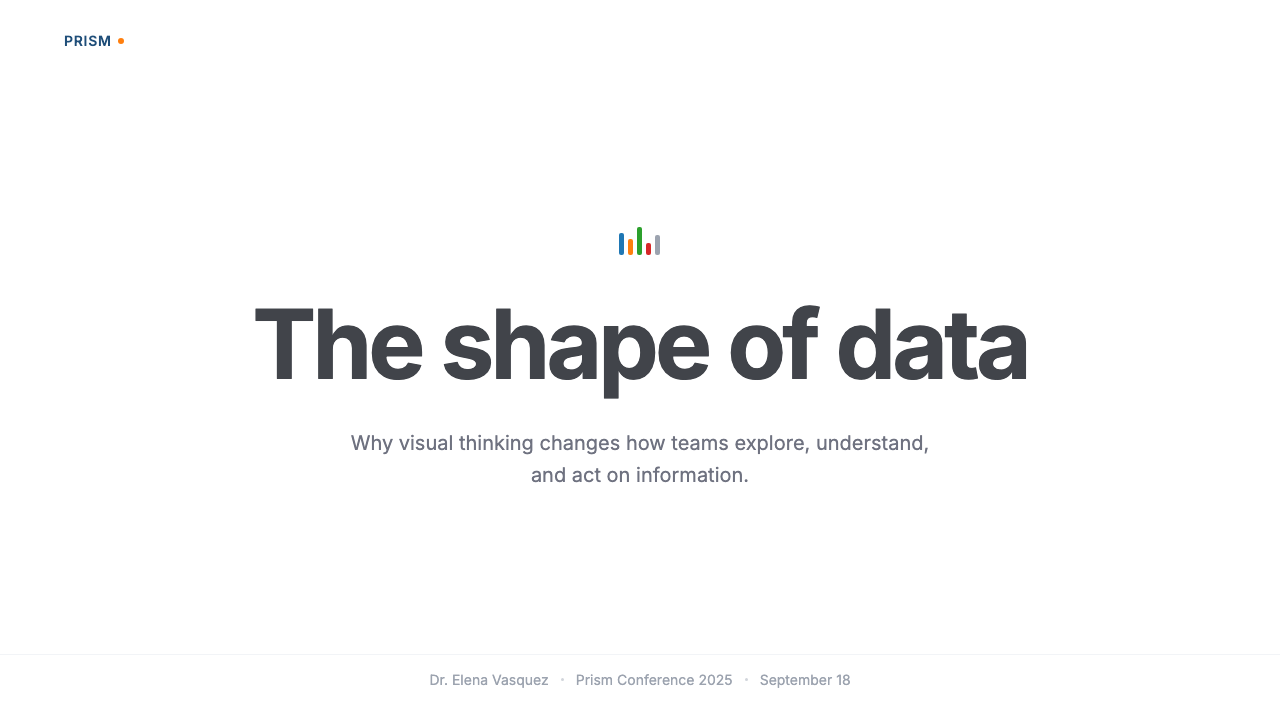
For presentation slides, the Tableau style translates into a distinctive cover-and-content approach. A cover slide works well with a navy or very deep blue field, a title set in geometric sans-serif at display weight, and a data visualization — a bar chart, a scatter plot, a map — shown partially or fully as a compositional element rather than an information-carrying one. The visualization becomes a graphic object that signals the analytical nature of the content to follow. Content slides should treat their chart area as a white field within a lightly bordered container, with all annotation and labeling done at small, functional sizes. Data slides are where the full Tableau vocabulary shines: categories colored from the ten-color palette, axes set thin and pale, grid lines hairline, and no decorative elements whatsoever.在演示文稿中,Tableau 风格转化为一种独特的封面与内容页方法。封面幻灯片在深蓝或极深蓝色底面上效果出色,标题以展示字重的几何无衬线字体呈现,并展示一个数据可视化——柱状图、散点图、地图——部分或完整地作为构图元素而非信息载体。这个可视化成为一个图形对象,向受众预示后续内容的分析性质。内容幻灯片应将其图表区域作为轻边框容器内的白色区域来处理,所有注释和标签以小而实用的尺寸呈现。数据幻灯片是 Tableau 完整词汇大放异彩之处:类别颜色来自十色调色板,坐标轴细而浅,网格线发丝级细,没有任何装饰元素。
For web interfaces — particularly dashboards, analytics products, and business intelligence tools — the Tableau visual language provides a ready-made grammar for communicating analytical authority. Navigation and chrome elements take on the dark structural color, while the content area remains white or very light. Card components can use subtle, flat-gray backgrounds rather than white to create visual grouping without introducing color hierarchy. Interactive elements — dropdowns, filter chips, toggle switches — should borrow the pill-shaped filter grammar when appropriate, signaling to analytical users that the interface belongs to a familiar family of tools. Pricing pages and product marketing pages in this space benefit from the style's sense of authority: a Tableau-inflected layout reads as rigorous and enterprise-grade before a single word is processed.对于网页界面——特别是仪表板、分析产品和商业智能工具——Tableau 视觉语言提供了一套现成的语法,用于传达分析权威感。导航和框架元素采用深色结构色,而内容区域保持白色或极浅色。卡片组件可以使用微妙的平面灰色背景而非白色来创建视觉分组,而不引入颜色层级。交互元素——下拉菜单、筛选芯片、切换开关——应在适当时借用药丸形筛选语法,向分析用户表明该界面属于熟悉的工具家族。该领域的定价页面和产品营销页面受益于这种风格的权威感:一个 Tableau 风格的布局在处理任何文字之前就传达出严谨与企业级的印象。
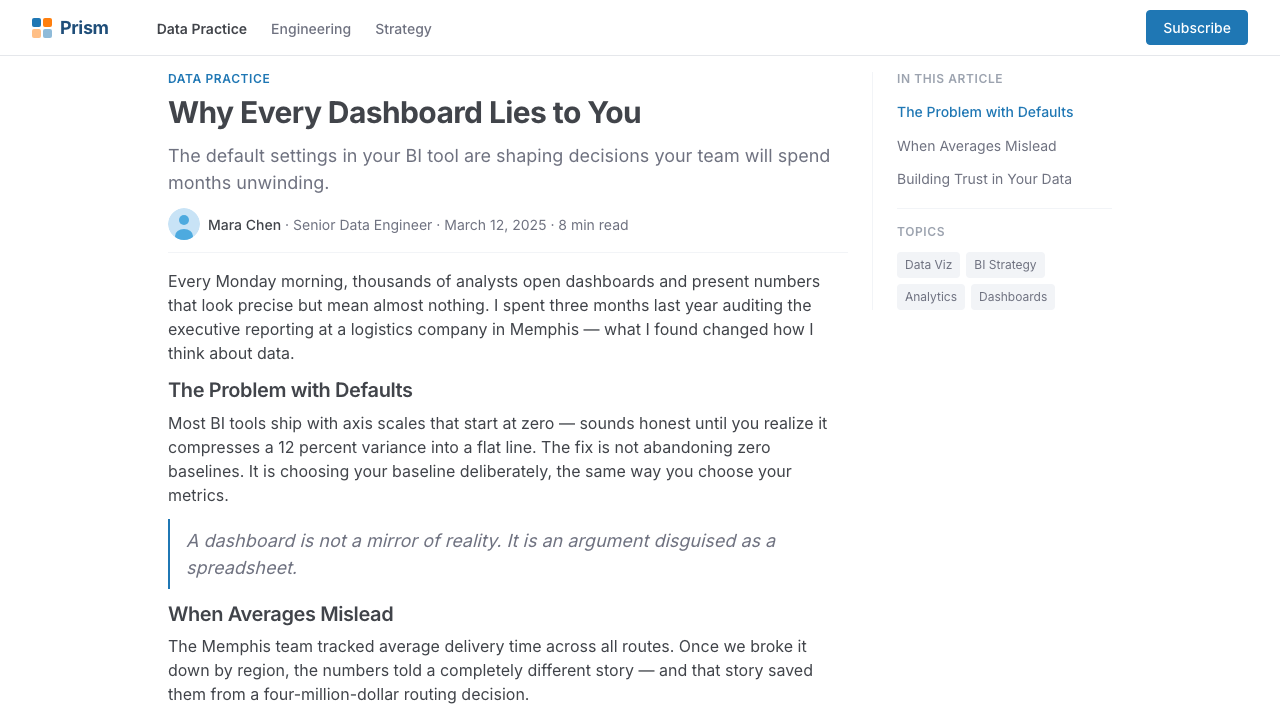
In editorial and marketing contexts outside the enterprise software category, the style functions best as a signal of data-driven seriousness. A research report, an annual review, or an infographic publication that adopts the Tableau visual grammar — white background, pale grid lines, categorical colors, sans-serif type — communicates analytical rigor to audiences who recognize the aesthetic from their professional tools. The style is less appropriate for consumer-facing contexts that require warmth, sensory richness, or cultural specificity. A food brand, a wellness product, or a children's platform would find the Tableau palette too corporate and the composition too clinical.在企业软件类别之外的编辑与营销场景中,这种风格最能作为数据驱动严肃性的信号发挥作用。采用 Tableau 视觉语法的研究报告、年度回顾或信息图出版物——白色背景、浅色网格线、分类色彩、无衬线字体——向从专业工具中熟悉这种美学的受众传达分析严谨性。这种风格在需要温暖感、感官丰富性或文化特殊性的面向消费者场景中不太适合。食品品牌、健康产品或儿童平台会发现 Tableau 调色板过于企业化,构图过于临床化。
A common mistake when applying the Tableau aesthetic is treating it as synonymous with any data visualization that uses a multi-color palette. The distinctive qualities of the style are its restraint — the pale grid, the navy chrome, the white canvas — not its colors in isolation. Placing the ten-color palette on a dark background, surrounding it with decorative elements, or pairing it with high-contrast typography that competes with the data marks produces a result that reads as inspired by Tableau rather than coherent with it. The most frequent failure mode is adding visual richness — gradients, gloss, ambient shadow, patterned backgrounds — in an attempt to make the design feel more finished. In the Tableau vocabulary, finish is achieved through precision and consistency, not through decoration.应用 Tableau 美学时最常见的错误,是将其等同于任何使用多色调色板的数据可视化。这种风格的独特品质在于其克制——浅色网格、深蓝框架、白色画布——而非孤立地看待其颜色。将十色调色板置于深色背景上,用装饰元素包围它,或与和数据标记相竞争的高对比度字体搭配,会产生一个看起来受 Tableau 启发而非与之连贯的结果。最常见的失败模式是添加视觉丰富性——渐变、光泽、环境投影、图案背景——试图使设计看起来更完善。在 Tableau 词汇中,完善感是通过精确和一致性实现的,而非通过装饰。
See the Tableau (Business Intelligence) design system查看 Tableau (Business Intelligence) 完整设计系统
Tableau (Business Intelligence) — FAQTableau (Business Intelligence) · 常见问题
Is the Tableau style appropriate outside of data visualization contexts?Tableau 风格适合用于数据可视化场景之外吗?
It is applicable beyond pure data visualization, but its associations are strong enough that it carries analytical connotations wherever it appears. Contexts where those connotations are valuable — research publications, financial reports, technology product marketing, enterprise SaaS interfaces — benefit from borrowing the visual vocabulary. Contexts where the connotations feel mismatched — consumer lifestyle products, creative portfolios, cultural institutions — should approach the style with caution or avoid it. The style's authority is one of its greatest assets and one of its most significant constraints.它确实可应用于纯数据可视化之外,但其联想足够强烈,以至于无论在哪里出现都携带着分析性内涵。那些这些内涵有价值的场景——研究出版物、财务报告、技术产品营销、企业级 SaaS 界面——受益于借用这套视觉词汇。那些内涵感觉不匹配的场景——面向消费者的生活方式产品、创意作品集、文化机构——应谨慎对待这种风格或避免使用。这种风格的权威感既是其最大资产,也是其最显著的制约。
How does Tableau's palette differ from other data visualization color systems?Tableau 的调色板与其他数据可视化色彩系统有何不同?
Tableau's categorical palette is distinguished by three qualities: its perceptual spacing, its accessibility calibration, and its restraint in saturation. Many competing palettes are designed primarily for visual appeal and use fully saturated hues that can be hard to distinguish in quantity or for color-blind viewers. Tableau's palette treats each color as a data channel — it must be distinguishable from its neighbors under varied viewing conditions, at small mark sizes, and for the significant portion of the population with some form of color vision deficiency. The result is a palette that appears slightly muted compared to fully saturated alternatives but performs more reliably across real-world use cases.Tableau 的分类调色板以三种品质著称:感知间距、可及性校准和饱和度的克制。许多竞争性色板主要为视觉吸引力而设计,使用在数量多时或对色盲用户难以区分的全饱和色调。Tableau 的色板将每种颜色视为数据通道——它必须在不同观看条件下、在小标记尺寸下,以及对于相当一部分存在某种色觉缺陷的人群而言都能与相邻色区分。结果是一套与全饱和替代方案相比显得略微柔和的色板,但在实际使用场景中表现更为可靠。
Can the Tableau visual style work in a dark-mode or dark-background layout?Tableau 视觉风格能在深色模式或深色背景布局中使用吗?
Tableau itself offers a dark theme in its interface, and dark-background dashboards have become a popular choice for executive-facing displays and real-time monitoring screens. When inverting the palette, the key discipline is to keep the chart canvas significantly lighter than the chrome — or to treat the chart area as a distinct dark-but-not-black zone that still maintains high contrast against the data marks. The categorical palette requires more careful management on dark grounds: colors that read well against white may lose distinctiveness against charcoal or near-black. A dark Tableau-inflected layout tends to work best when it restricts the active palette to three or four colors from the standard set rather than using all ten simultaneously.Tableau 本身在其界面中提供深色主题,面向高管的显示屏和实时监控大屏中深色背景仪表板已成为流行选择。反转色板时,关键原则是保持图表画布明显亮于框架——或将图表区域视为一个独特的深色但非黑色区域,仍与数据标记保持高对比度。分类调色板在深色底面上需要更谨慎的管理:在白色底面上清晰呈现的颜色在炭灰色或近黑色上可能失去区分度。深色 Tableau 风格布局往往在将活跃色板限制为标准集中的三到四种颜色而非同时使用全部十种时效果最佳。
What makes a Tableau-styled layout feel authentic versus derivative?是什么让 Tableau 风格的布局感觉真实而非衍生?
Authenticity in the Tableau style comes from functional logic, not surface copying. The three markers of genuine engagement with the style are: first, that the white chart canvas is protected — no decorative elements intrude into the data field; second, that hierarchy is established through scale and weight alone, with color reserved for categorical data encoding rather than structural emphasis; and third, that the chrome elements — navigation, controls, container borders — are genuinely subordinate to the data surface. Derivative applications typically fail on the third point, either over-designing the chrome or applying the categorical palette to structural rather than data-encoding roles.Tableau 风格的真实性来自功能逻辑,而非表面复制。真正理解这种风格的三个标志是:第一,白色图表画布受到保护——没有装饰元素侵入数据区域;第二,层级仅通过尺度和字重建立,颜色被保留用于分类数据编码而非结构强调;第三,框架元素——导航、控件、容器边框——真正服从于数据表面。衍生性应用通常在第三点上失败,要么过度设计框架,要么将分类调色板应用于结构性而非数据编码性角色。
How should the Tableau style be adapted for non-English audiences or global products?Tableau 风格应如何针对非英语受众或全球产品进行调整?
The Tableau visual language is highly portable across cultures because it relies on structural logic rather than cultural symbolism. Its color associations are data-driven rather than culturally specific — blue for navigation chrome, the categorical palette for data series — so they do not carry the same cultural weight as, for example, the symbolic use of red and gold in East Asian design. Typography requires the most adaptation: the geometric sans-serif letterforms that anchor the style in Latin-script contexts have direct equivalents in most writing systems, but the selection of those equivalents requires care to preserve the weight, openness, and geometric quality that the style depends on. In right-to-left scripts, the workbook layout mirrors naturally, and the structural logic of chrome-plus-canvas is language-agnostic.Tableau 视觉语言在跨文化方面具有高度可移植性,因为它依赖结构逻辑而非文化象征。其色彩联想是数据驱动的而非文化特定的——导航框架用蓝色,数据序列用分类调色板——因此不像例如东亚设计中红色与金色的象征性使用那样承载文化重量。字体排印需要最多的调整:在拉丁字母语境中锚定这种风格的几何无衬线字形在大多数书写系统中都有直接对应物,但选择这些对应物需要谨慎,以保留这种风格所依赖的字重、开放性和几何品质。在从右到左的文字系统中,工作簿布局自然镜像,框架加画布的结构逻辑是语言无关的。
Related design styles相关设计风格
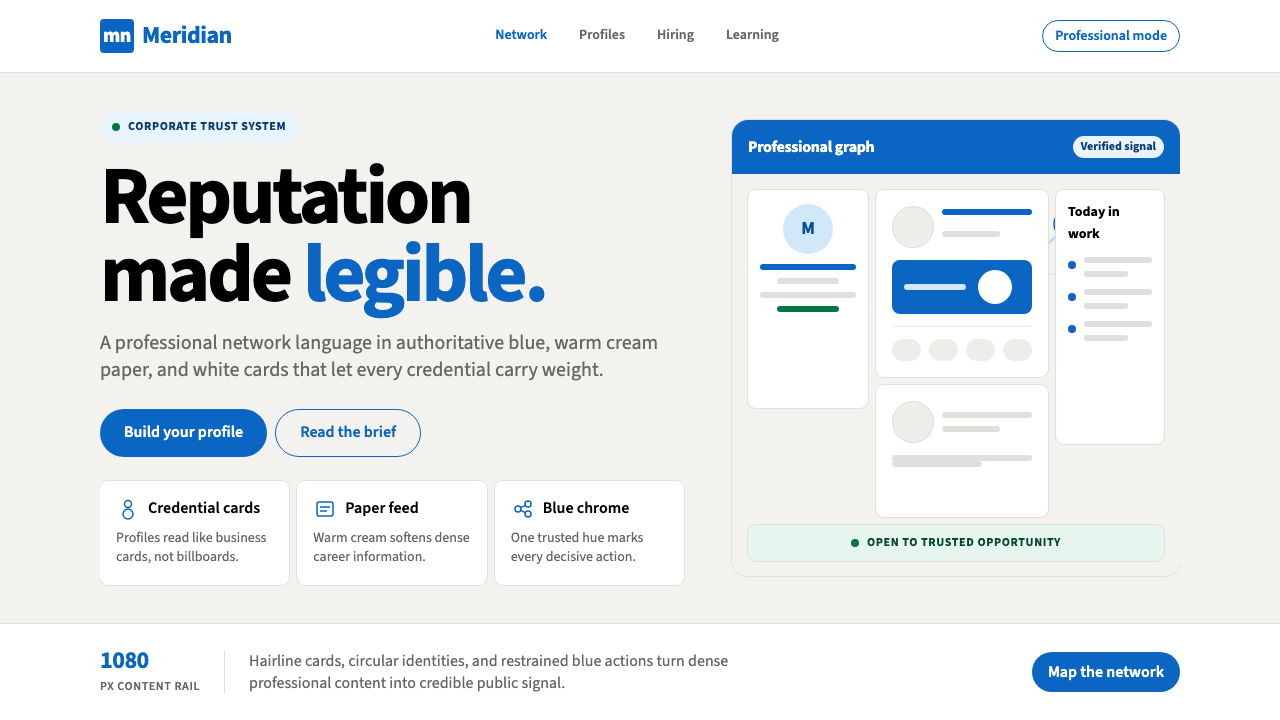 LinkedInCorporate trust, digitized. Authoritative blue frames white cards on warm cre…企业信任数字化:权威蓝框住暖奶油纸面上的白卡。
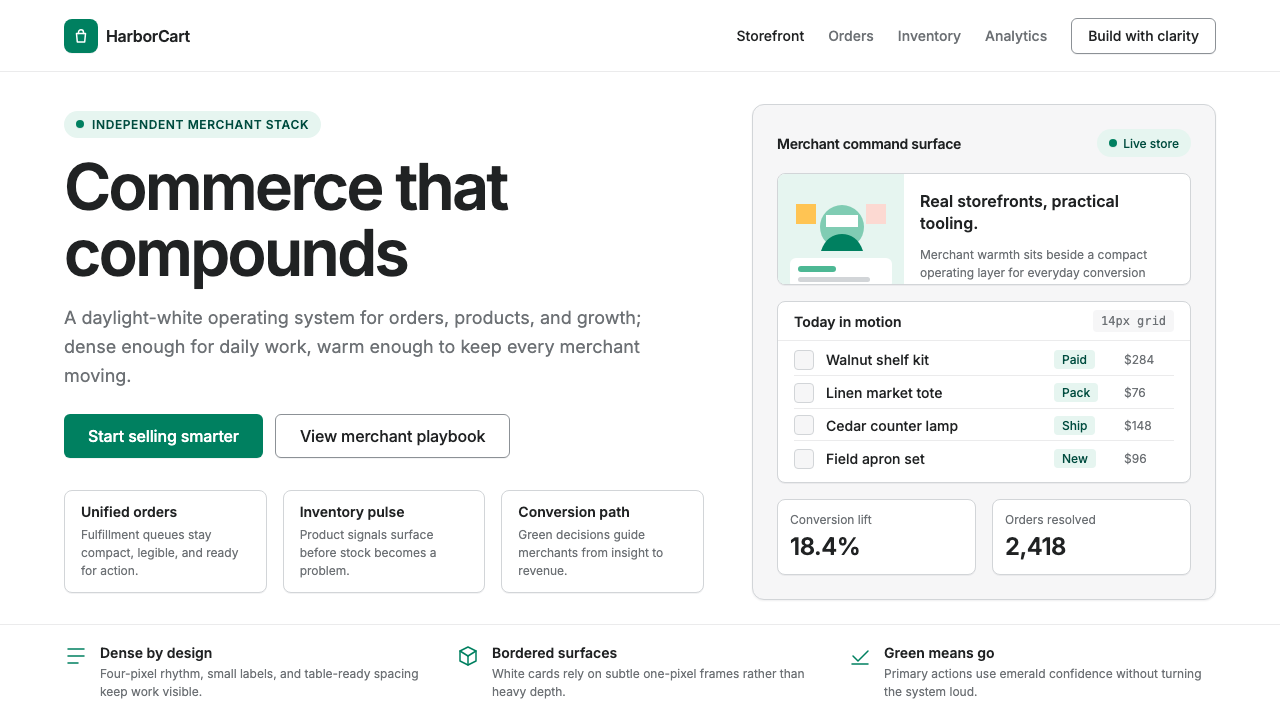 Shopify ModernMerchant ally, not corporate SaaS. Emerald actions on bordered white cards ca…商户盟友而非企业感:翡翠绿动作与白色描边卡片承载密集商业。
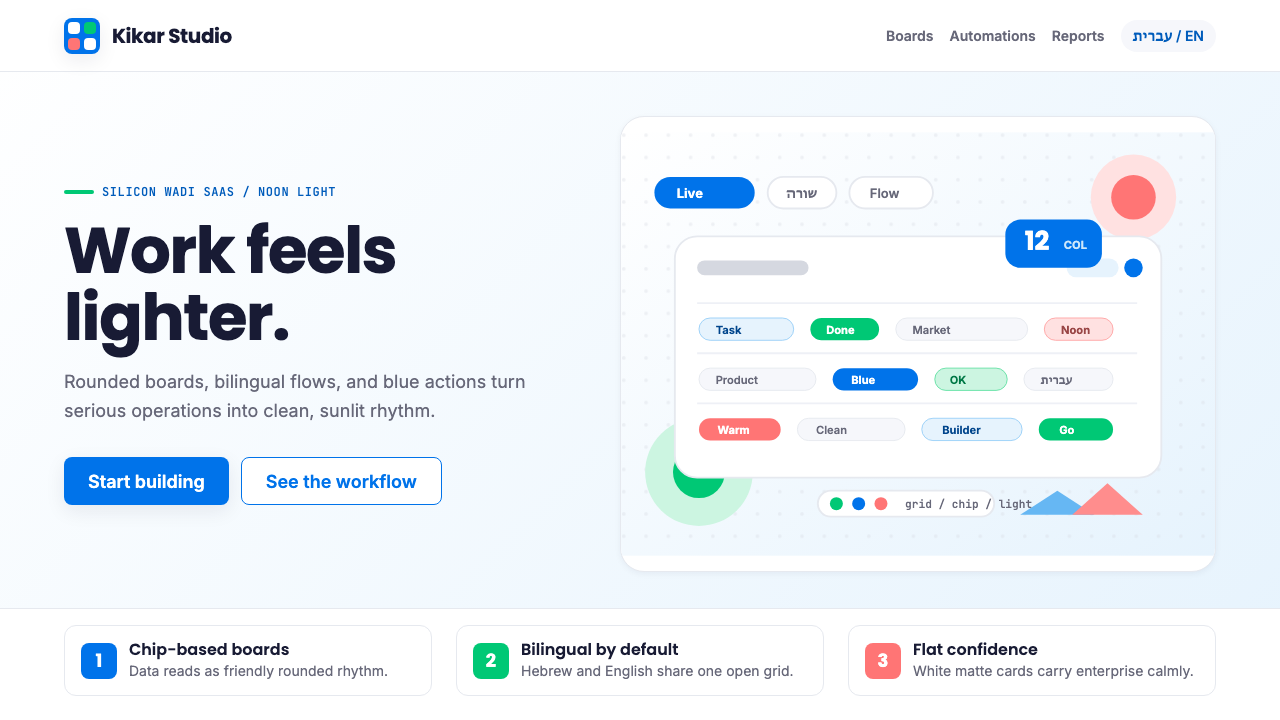 Tel Aviv Silicon WadiEnterprise feels sunny. Azure chips and Poppins grids soften flat SaaS surfac…企业软件也有阳光感:天蓝色芯片与 Poppins 网格软化平面 SaaS。
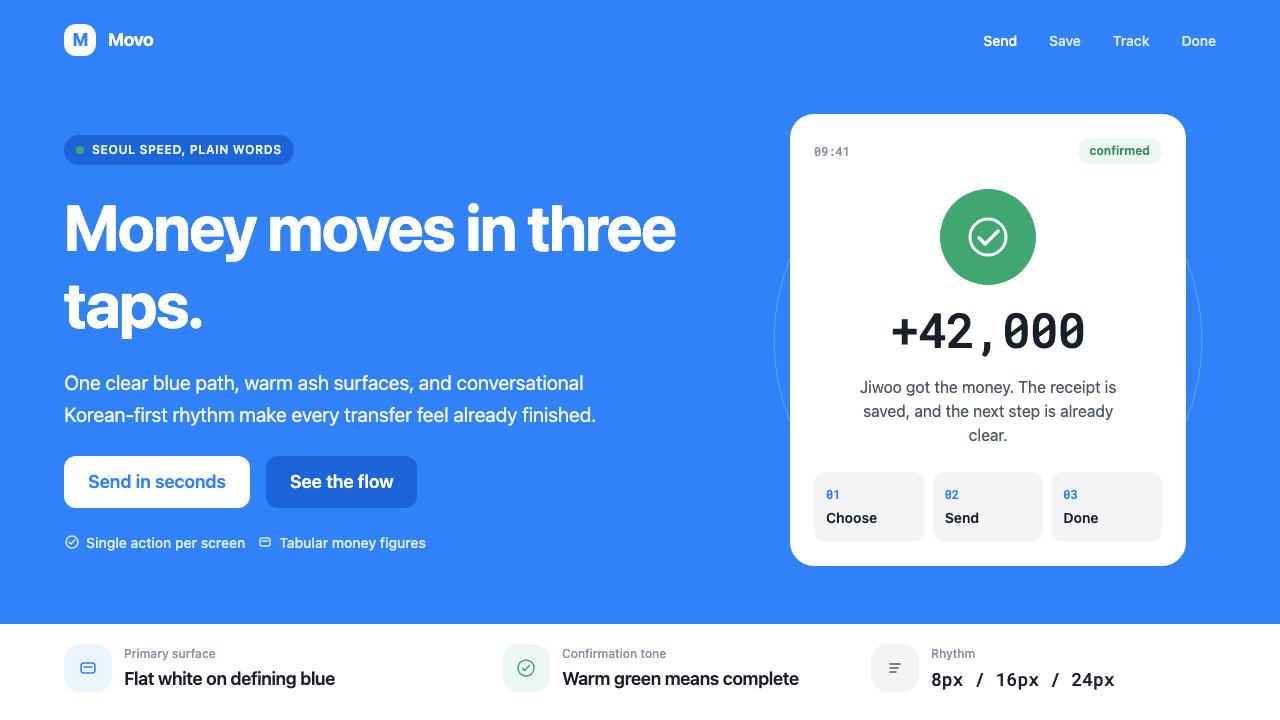 Toss Korean Fintech BlueMoney feels instant. Signature blue, Pretendard scale, and one-screen transfe…转账像短信一样快。标志蓝、Pretendard 与单屏节奏支撑信任。
 Zoom Meeting BlueRemote work's default discipline. One saturated cobalt on pure white, Inter s…远程办公的默认纪律:饱和电子钴蓝压在纯白底上,Inter 无衬线,4px 柔角。
 Android Bugdroid GreenFriendly tech, reduced to geometry. Vivid green pops from Grey 900 and rounde…友好科技化为几何:明绿从 Grey 900 与圆润字形中跃出。