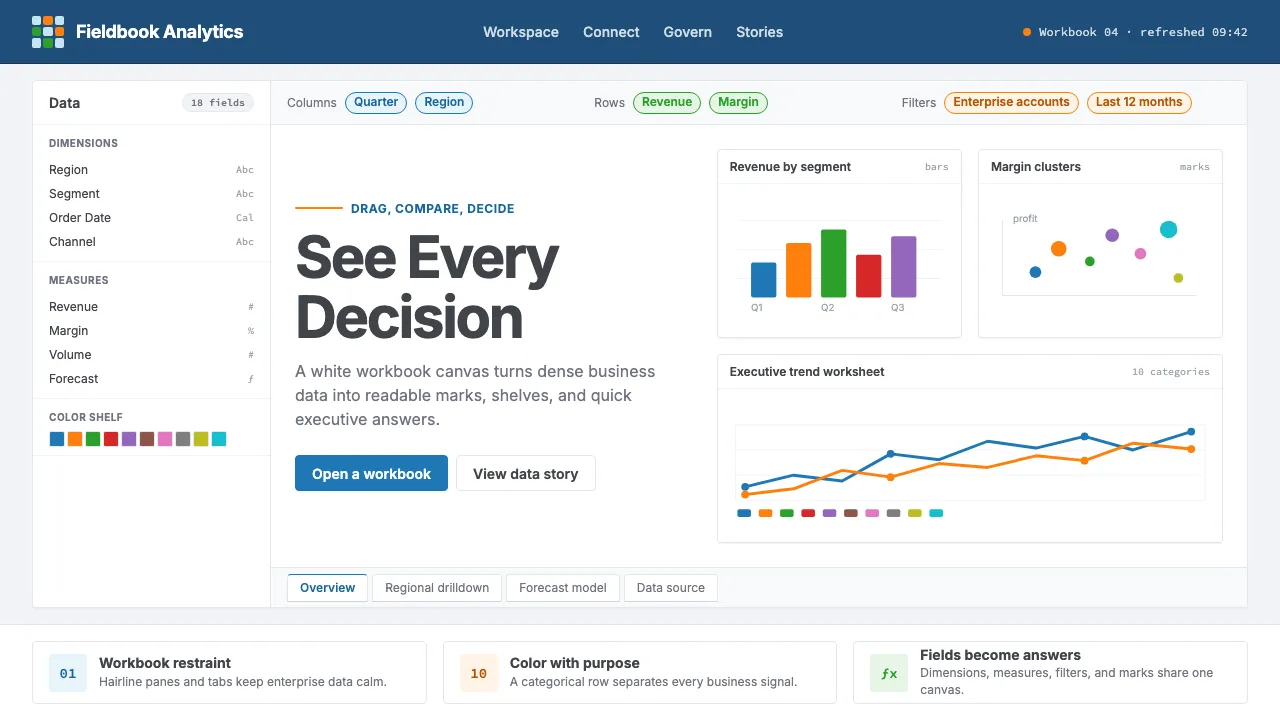
About Tableau (Business Intelligence)
Tableau turned Pat Hanrahan's Stanford research on visual query languages into the dominant enterprise analytics platform — a $15.7B Salesforce acquisition built on drag-and-drop data exploration. Its visual identity is workbook restraint: navy chrome framing a white canvas, the iconic 10-color categorical palette engineered for color-blind safety, and geometric sans typography at comfortable reading sizes.
The brand reads as Excel-meets-modern-design — dense but navigable, enterprise but approachable. Filter-shelf pills, marks cards, and worksheet tabs create a distinctive interaction vocabulary that millions of analysts recognize instantly.
- Origin
- Seattle, Washington / San Francisco, California
- Era
- 2003 founded (Stanford PhD spinoff); current visual ~2019–2024 post-Salesforce
- Key figures
- Pat Hanrahan · Chris Stolte · Christian Chabot · Mark Nelson
- Movements
- Business intelligence software · VizQL visual-query-language · Salesforce design-system integration
Tableau (Business Intelligence) design spec
Colors
Typography
The other 11 sections — buttons, cards, spacing, motion, techniques and more — open once you unlock. Download the DESIGN.md or send it to your AI in one click. Unlock once, yours forever.
Sign up nowStyles similar to Tableau (Business Intelligence)
Also inspired by brands & products, with a close feel.
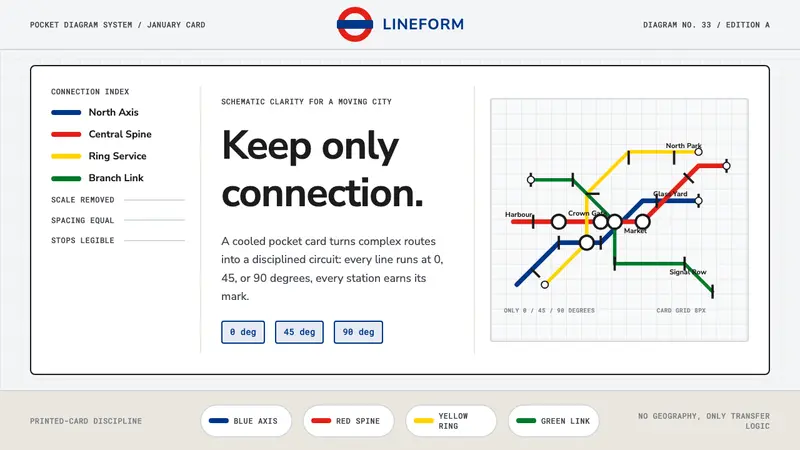 Tube Map (Beck)Connection beats geography. Blue-red-yellow routes snap to a cool card grid.
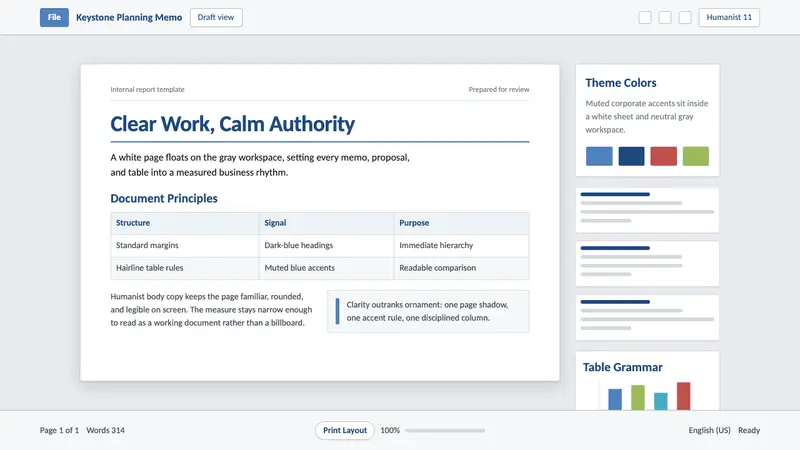 Office Document (Calibri 2007)Quiet authority. White page sheet, muted blue rules, and humanist-sans rhythm.
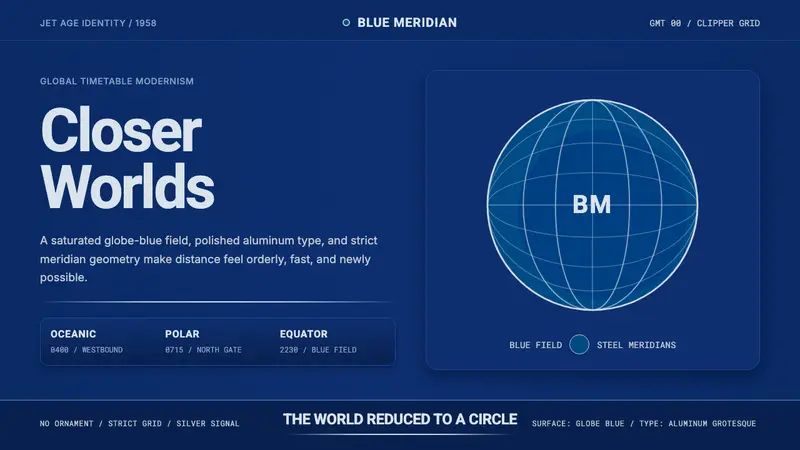 Pan Am Jet AgeJet-age confidence. Globe-blue field, steel type, meridian circle on a strict grid.
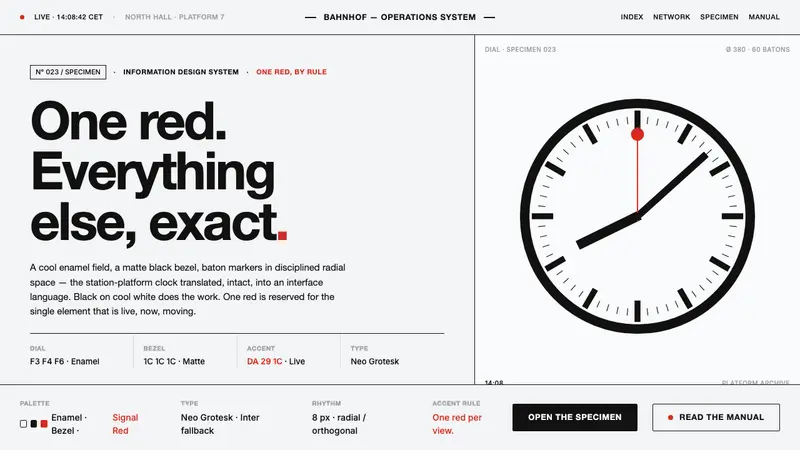 Hilfiker Railway ClockEverything exact, one thing live. Black hands on cool enamel white — one red second-hand by rule.