What is Snellen Eye Chart?
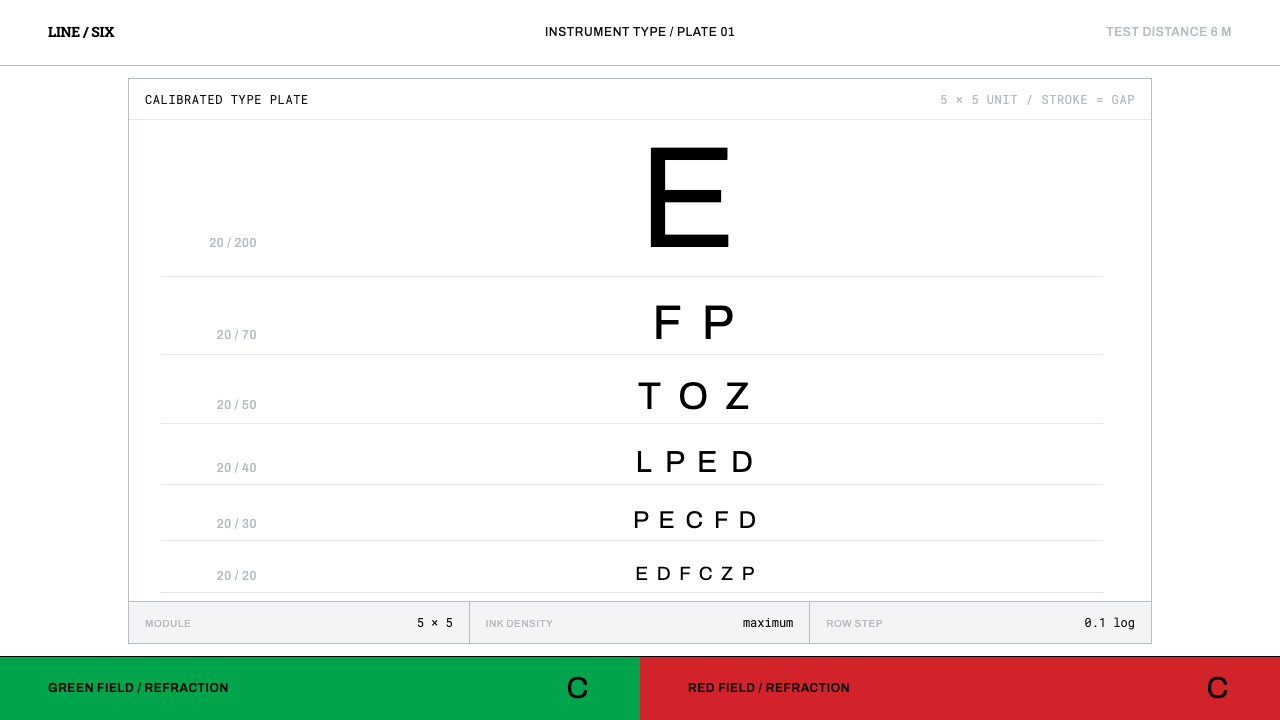
The Snellen chart is type pressed into service as an instrument — black letters on a white card, each built on a five-by-five grid and shrinking in measured steps.
Snellen Eye Chart in brief
The Snellen eye chart is the familiar card of black letters that shrink row by row, used to measure how sharply a person sees. As a design system it is something rarer than a style: it is a specification. Each letter, called an optotype, is drawn on a square grid five units across and five units high. The width of every stroke equals the white gap between strokes, and both equal one fifth of the letter's height. At the standard test distance of six metres, the line labelled 20/20 is built so that each stroke spans exactly one minute of arc in the viewer's eye.
Visually, everything follows from that rule. The palette is black ink on a white card. The letters are blunt and square-shouldered, descended from the heavy slab faces of nineteenth-century display lettering, and they come from a closed set of nine. They are stacked in centred rows: a single enormous letter at the top, then rows that grow more numerous and smaller as they descend. The white between the rows is not leftover space. It is measured space, scaled to the letters it separates.
The result is a design in which nothing is there for its own sake. The surface of the card carries a lighting requirement so that it is evenly lit, the alphabet is restricted so that no letter is easier than another, and the rows step down by a regular ratio. To design in the spirit of the Snellen chart is to treat layout as instrumentation: black ink, white card, and proportions you could check with a ruler. The red and green twin panels used in the same examination room are a different instrument, not a colour accent.

Where does Snellen Eye Chart come from?
Herman Snellen published his chart in Utrecht in 1862. He was a Dutch ophthalmologist, and what he produced, without quite meaning to, was one of the strictest type specifications in the history of printing. The problem he was solving was clinical rather than typographic: to say how well a patient sees, a clinician needs a number that means the same thing in every consulting room. Snellen's answer was a fraction, the now-familiar 20/20, comparing the distance at which a patient is tested with the distance at which a standard eye can just resolve the same letter.
The brilliance of the specification is that it ties the letter to the eye rather than to the page. A letter is legible when its parts are far enough apart to be resolved, so each optotype is drawn on a grid in which strokes and gaps are the same size, and the size is fixed so that at the test distance they subtend a known visual angle. The chart therefore tests a physical capacity, not a reading ability. Any single line corresponds to a distance at which a standard eye can just distinguish the detail, and that correspondence is what turns a printed card into an instrument.
The letterforms did not stay still. The source dates their standardisation to a long span between 1868 and 1959, and names John Green and Louise Sloan among the key figures. Green's name belongs at the earlier end: he is remembered for pressing for a regular progression of letter sizes, the measured log steps that the chart's blurb refers to, so that each line differs from the next by a constant proportion rather than an arbitrary jump. Sloan's belongs at the later end, with a redrawn and restricted set of letters chosen to be equally hard to recognise. The source also lists Egyptian slab display typography among the traditions behind the original shapes, heavy and blunt faces from the age of posters and shop fascias, and the later work gradually replaced those slab forms with plainer ones.
The specification has been maintained into the present day. The source cites a British Standard, BS 4274-1, revised in 2003, which governs test charts, and the clinical practice of the chart extends across the world: a Dutch design of 1862 that remains, for many people, the first time they meet the idea of acuity at all. Clinical ophthalmology kept it alive, and that clinical origin is also why the chart has a curious status in design circles. It is a piece of typography that was never meant to be beautiful, and it became iconic precisely because it is so uncompromisingly purposeful.
What defines the Snellen Eye Chart look?
Black on White
The palette is a single ink on a single card: pure black on white, with nothing between. The white is not simply a background colour. It is a lit surface with a stated brightness and an even spread of light across the whole card, so that contrast is a specified quantity rather than a mood. Colour, tint and grey are absent because each would change what the chart measures.
The Five-by-Five Grid
Every optotype is constructed on a square grid five units wide and five units high. Stroke width equals the gap between strokes, and both equal one fifth of the letter's height. This makes every letter a diagram of itself. A designer can rebuild any row from nothing but the rule, which is the opposite of how most typefaces work, where optical correction and the designer's taste bend every curve.
A Closed Letter Set
The letters come from a closed set of nine, chosen so that none is conspicuously easier to recognise than another. This is the opposite of an alphabet built for reading, where variety and distinctiveness are virtues. On the chart, personality in a letter is a bug. The closed set reminds designers that constraint can be a feature: a small vocabulary used with total consistency reads as authority.
Measured Log Steps
Each row is smaller than the one above it by a regular proportion, and each row is labelled with its fraction at the margin. The hierarchy is therefore entirely a matter of scale. There is no bold-versus-regular, no colour coding and no decoration marking one level from the next. Size alone ranks the rows, and the steps are regular enough that a viewer senses the logic before reading a single label.
Measured Space
The white between letters and between rows scales with the letters, rather than being a fixed margin applied everywhere. Large letters sit in large clearings and small letters in small ones. The effect is a calm, generous page whose emptiness is as deliberate as its ink. Whitespace here is not breathing room added for comfort; it is a dimension of the specification, and any change to it would alter the result of the test.
Instrument, Not Ornament
There are no gradients, no shadows, no rounded corners and no ornament of any kind. Nothing is there to be liked, because the card has to work identically for every patient in every room. This is the discipline that makes the style so useful as a reference for tools, dashboards and technical documents: every element can be defended as a measurement, and anything that cannot be defended is removed.

Who shaped Snellen Eye Chart?
The Dutch ophthalmologist who published the chart in Utrecht in 1862 and gave it its name. His real invention was the relationship between letter and eye: a letter whose strokes and gaps are the same size, scaled so that they subtend a known visual angle at a known distance. The chart turned vision from an impression into a fraction that clinicians in different places could compare, and the same logic of designing for a measurable viewer still shapes accessibility work today.
Green is remembered in connection with the 1868 end of the source's long standardisation period, and above all for urging a regular progression in letter sizes. His contribution is the discipline of the log step: each line differs from the next by a constant proportion, so the chart behaves like a ruler rather than a list. For a designer this is a model for a type scale, where the steps are chosen by ratio and not by eye.
Sloan stands at the 1959 end of the same span, associated with a redrawn and restricted set of letters designed to be equally hard to recognise. Her work moved the chart away from the heavy slab forms of its origin toward plainer, more uniform shapes, and it reinforced the principle that the chart should measure the eye and not the reader's vocabulary. The lesson for design systems is that standardisation is an ongoing editorial act, not a one-time decision.
The source cites BS 4274-1, revised in 2003, as the modern standard for test charts. The people who write such documents are anonymous, but their role is the one that keeps an instrument trustworthy: they say how bright the card must be, how evenly lit, and how the letters must be drawn. They are a reminder that a rigorous visual system is maintained by documentation as much as by taste.
How do you use Snellen Eye Chart today?
The Snellen chart is one of the purest sources for a design that wants to look exact. Its principles are structural: a single ink, proportional steps, measured space and a vocabulary that never decorates. Applied well, it gives a product or document the feeling of having been calibrated.
For presentation slides, the chart is the cover. Set a white field, centre the title as the top and largest row, and let a few lines of decreasing size carry the subtitle, author and date as the chart's smaller rows. Content slides should treat hierarchy as scale alone: one organising axis, two or three sizes related by a constant ratio, and no coloured highlights. Data slides gain from the ruler-like precision: tables with fractions or ratios at the margin, and bar charts in a single black with generous clear space around each bar.
For web interfaces, the style suits dashboards, technical documentation, status pages and settings screens, anywhere that users must trust a number. Keep the surface white, use black for all text, and build the type scale from a regular proportion rather than a handful of arbitrary sizes. Pricing pages can borrow the margin labels, showing each tier's value as a plain ratio or figure at the edge of the row. Components should have no shadow, no gradient and no rounded softness; a thin, firm rule is the only ornament the system allows.
For editorial and marketing work, the chart works for reports, lab and test results, product specification sheets, eyewear and health campaigns, and anything about measurement, calibration or proof. A single oversized glyph above a row of small ones is an instantly readable poster. Pair it with copy that is as exact as the layout, and let the whitespace do the persuading.
The most common mistake is to treat the chart as a decorative texture: adding colour, a glow, rounded corners or random letters to make it look friendlier. Each of these breaks the logic that makes the style work, and the result is a vision-chart costume without an instrument inside. A second mistake is more serious: a layout inspired by the chart is not a calibrated chart, and it must never be used to measure anyone's eyesight. Use the look for design, and leave real measurement to real equipment.

Snellen Eye Chart — FAQ
What does 20/20 actually mean?
It is a fraction comparing two distances: the distance at which a person is tested, and the distance at which a standard eye can just resolve the same letter. On the chart, the 20/20 line is built so that each stroke spans one minute of arc at the test distance. It is a reference line, a benchmark for typical clear sight, and not a measure of perfect or superhuman vision. Many people read lines below it, and the chart's log steps are there to show that.
Why does the chart use only a closed set of letters?
Because the chart is measuring the eye, not the reader. If some letters were easier to recognise than others, a patient could pass a line by guessing from shape or context, and results would vary from chart to chart. A small closed set, drawn on the same grid, keeps the difficulty even. For designers the lesson is that a deliberately narrow vocabulary can be more trustworthy than a wide one.
Can I use the look without making a real eye chart?
Yes, and that is the intended use for a design system. Borrow the proportional scale, the single black ink, the white card and the measured space. Do not claim that a layout can test sight: a calibrated chart depends on printed size, viewing distance and lighting, none of which a screen layout can guarantee. Keep the look as a reference for precision, and keep clinical measurement in clinical hands.
Why no colour, and what about the red and green panels?
Colour would change what the chart measures, so the card stays black and white. The red and green panels in the same examination room are a separate instrument for a different test, not an accent colour for the chart. If a layout needs an emphasis colour, treat it the way the exam room does: as a different tool brought in for a specific job, used sparingly and never mixed into the primary reading surface.
Does the style work on a dark background?
The chart is a light-ground system. The white card is a lit, specified surface, and the black ink on it is the measured quantity. A dark inversion changes that relationship, because light letters on a dark field appear to spread and thicken, which alters how strokes and gaps read. If you must invert, keep the proportions and the single ink, favour slightly larger sizes, and accept that you have made a different object from the original.
Related design styles
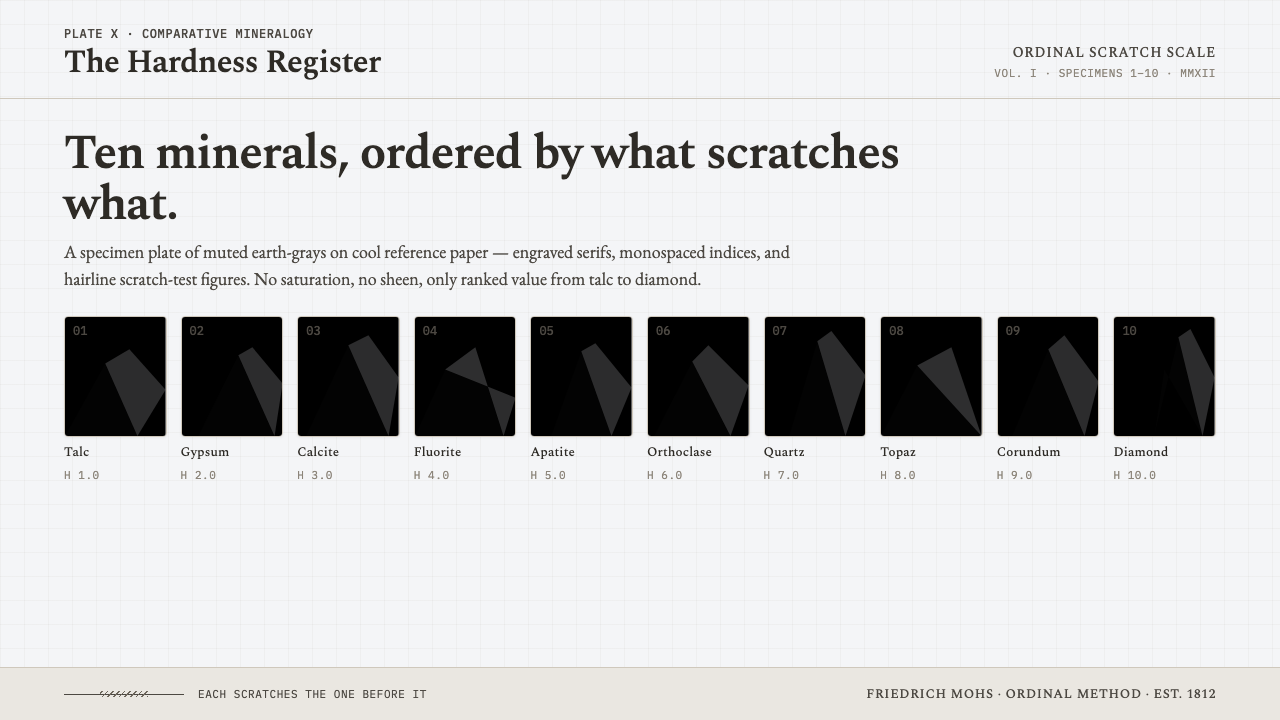 Mohs Hardness ScaleRanked by what scratches what. Ten mineral-gray chips on cool chart-white, en…
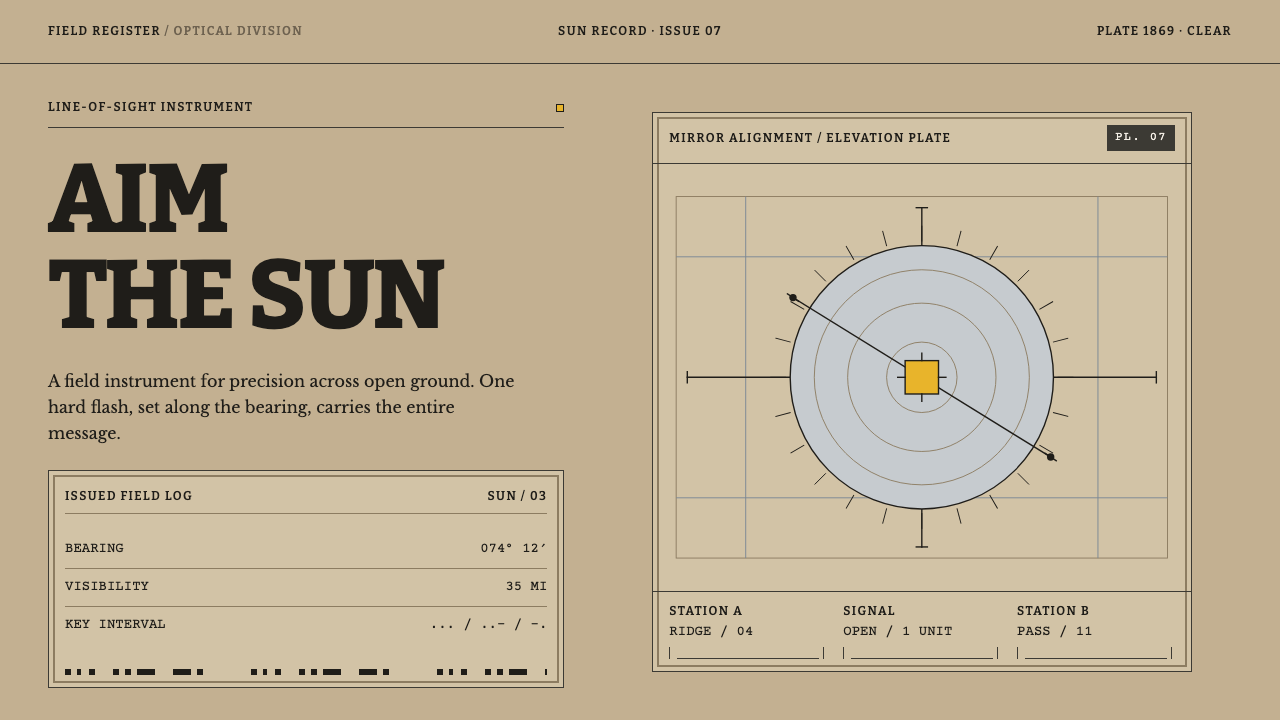 Heliograph SignallingAimed precision, not atmosphere. Khaki rules and Bitter slabs isolate one har…
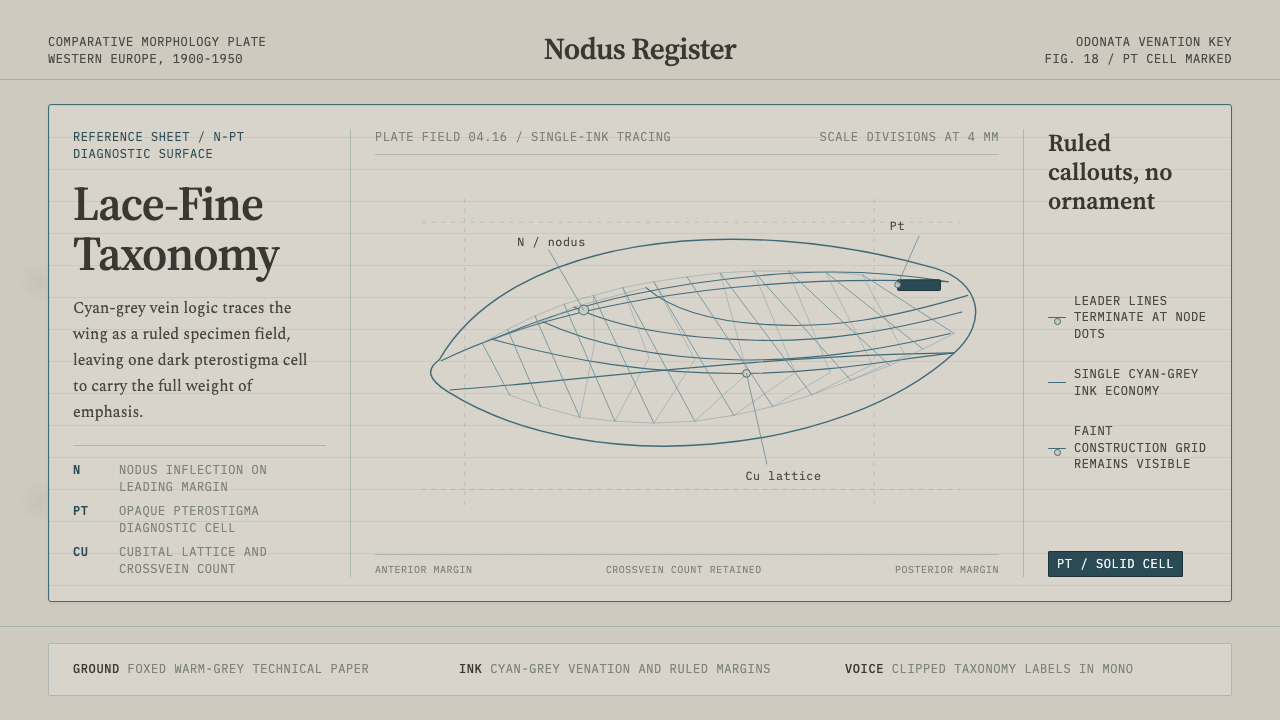 Dragonfly Wing VenationPrecision, nearly weightless. Cyan-grey veins rule a foxed paper taxonomy pla…
 Hauran Basalt StoneMonolith refuses shine. Charcoal Cinzel capitals lock into dry-laid basalt gr…
 Inca Ashlar StoneworkStone becomes the page. Granite-gray planes lock into hairline ashlar seams.
 Marine ChronometerPrecision survives motion. Silvered concentric rings yield only to one blued-…