What is Shipping Forecast?
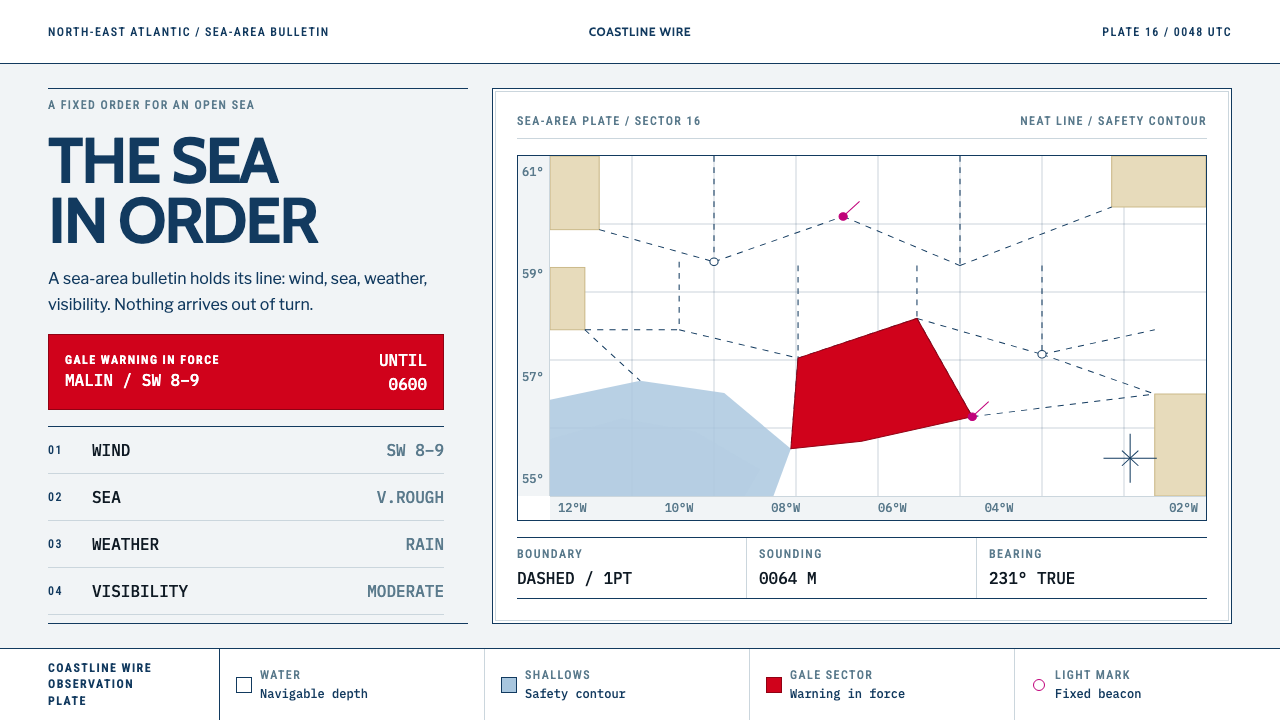
The Shipping Forecast turns weather into liturgy: thirty-one named sea areas, four unvarying parts, and a chart on which colour appears only when something is wrong.
Shipping Forecast in brief
Shipping Forecast is a design style drawn from two linked things: the BBC radio bulletin that has read out British sea-area weather for close to a century, and the Admiralty-style chart that sits behind it. The bulletin gives each area four parts in fixed order — wind, sea state, weather, visibility — and the chart gives each area a name, a boundary and a depth. The visual language that results is marine ink, chart white and a single gale-red sector, set in hairline lines, capital letters and monospaced figures.
The central idea is that safety must be spoken plainly. Nothing in a shipping forecast is there to entertain; every word is there so that a person on a boat in poor conditions can act on it. The style translates that into layout. Information arrives in a predictable order, labels are short, numbers are set so they can be compared at a glance, and decoration is simply absent. There are no rounded corners and no shadows, because a chart does not need them and a sailor cannot afford them.
Colour is the style's most distinctive rule. It is an event, not an ornament. Most of the page is ink on paper. Red fills an area only while a gale warning is in force, and magenta belongs to lights and beacons. Because colour is so scarce, any colour that does appear means something. That makes the style an unusually honest way to design interfaces for status, monitoring, alerts and public information.

Where does Shipping Forecast come from?
The Shipping Forecast is a bulletin of marine weather for the waters around the British Isles and the north-east Atlantic. It reads thirty-one sea areas in a fixed order, starting at Viking and moving clockwise around the coast, and for each one it gives wind direction and Beaufort force, sea state, weather and visibility, always in that sequence and in as few words as possible. The BBC has broadcast it for close to a century, and it is still read every day. The source dates the named-area bulletin and its clockwise order to the first half of the twentieth century, a period of growth in Met Office marine forecasting.
Its roots lie further back, in the work of Robert FitzRoy, a naval officer who helped establish national weather forecasting in Britain and understood that warning seafarers of coming storms was a matter of life and death. The principle that the weather office should tell the people at sea what they need to know, in a form they can use, is the foundation on which the broadcast bulletin stands. One of today's sea areas carries his name. The source also credits the Met Office marine forecast desk, the group of forecasters whose work supplies the content, and the BBC Radio 4 continuity announcers, whose steady delivery gives the bulletin its unmistakable cadence.
The visual source is not a weather app. It is the Admiralty chart, the hydrographic sheet issued by the British hydrographic service. On such a chart white indicates deep, navigable water, a buff tone marks land, and light blue is reserved for the shallows inside the safety contour. Boundaries are hairline, often dashed; names are set in capitals; soundings, the depth figures, appear as small numerals; and magenta marks lights and beacons. The chart is a working document, and every convention on it exists so that a navigator can read it quickly and without ambiguity.
The three movements the source lists are Admiralty hydrographic charting, British public-service broadcasting typography, and maritime safety signalling. Together they explain the design. From the chart comes the flat, ruled, unornamented surface. From broadcasting typography comes a plain, institutional voice with no room for flourish. From maritime safety signalling comes the idea that colour is a message: a warning flag, a gale cone or a lit beacon each means one thing, and nothing else gets to use that colour. The system keeps all three in play, which is why it looks calm, official and slightly austere.
What defines the Shipping Forecast look?
Chart White and Marine Ink
The base is the white of an Admiralty sheet, and the text and lines are in a deep marine ink, a dark navy rather than pure black. This pairing reads as paper and print rather than screen and glow. White carries the meaning of deep, open, navigable space, so empty areas on the page feel like water you can safely cross. The ink gives type and rules a slightly softer authority than black while staying fully legible.
Colour as an Event
Red appears only as a gale sector: an area filled in red while a warning is in force. Magenta is held for lights and beacons. Light blue marks only shallows inside the safety contour, and buff marks land. No colour is used decoratively, and each carries one meaning. The practical rule for designers is to decide in advance what each hue stands for and refuse to use it for anything else; the page then communicates status without a legend.
Hairline Dashed Boundaries
Areas are separated by very fine lines, often dashed, rather than by boxes, fills or cards. This makes structure visible without adding weight, and it gives the page the look of a plotted chart. Dividers, table rules and panel edges all follow the same hairline logic. Because lines are so thin, spacing and alignment must be exact; there is nothing heavy to hide an uneven grid.
Capitals and Monospaced Figures
Area names are set in capital letters, as on a chart, and depth, pressure and other measured values are set in a monospaced face so digits line up and can be compared down a column. This pair of conventions creates an instant two-register typography: names are labels, numbers are data. Body text stays plain and neutral. The effect is institutional but not cold, because the bulletin it descends from is spoken in a calm, human voice.
The Fixed Four-Part Order
Every area is reported in the same sequence: wind, sea state, weather, visibility. The style turns that into a template. Cards, table rows and list entries all follow a fixed order of fields, so a reader learns the pattern once and then scans without effort. Variation is allowed in the content, never in the order. The predictability is itself a safety feature: when conditions are poor, nobody should have to search for the field they need.
Clockwise Reading Order
The bulletin begins at Viking and circles the coast clockwise. The style borrows this as a layout principle: sequences have a defined start and a consistent direction, and the eye is led round a set of items rather than dropped into them. Where a map or diagram is used, numbering and flow follow the same direction. It is a small rule, but it makes the page feel like a route rather than a heap.
Flat, Square, Unshadowed
Nothing is rounded and nothing is shadowed. Corners are square, surfaces are flat, and depth is conveyed only by the chart's own convention: the light blue of shallows against the white of deep water. Panels do not float and buttons do not glow. This refusal of effects is not minimalism for its own sake; it is the same reasoning that keeps a navigation chart free of anything that could be mistaken for a hazard.

Who shaped Shipping Forecast?
A naval officer who helped found national weather forecasting in Britain in the nineteenth century and championed storm warnings for those at sea. His insistence that weather information be turned into a plain warning that people can act on is the founding spirit of the bulletin and of this design style. A sea area on today's list bears his name, which makes him the one figure who is literally on the chart.
The team of forecasters who write the content of the bulletin, compressing a huge amount of atmospheric and ocean data into four short parts per area. Their discipline of brevity, fixed vocabulary and constant order is the editorial equivalent of the design system. When a layout in this style feels dense yet effortless to read, it is because it imitates how this desk edits.
The voices who read the bulletin aloud, in a measured, even cadence that has become a national ritual. The delivery gives the text its liturgical quality: the same names, in the same order, in the same tone. Typographically this is the model for the style's calm, unemphatic hierarchy, where nothing is shouted and the content does the work.
How do you use Shipping Forecast today?
Shipping Forecast is the right choice when content is about status, conditions or public information and the reader needs to trust it. It suits anything that can be expressed as a set of named things reported in a fixed order, which is a much wider category than weather.
For presentation slides, a cover can use a clean chart-white field, a single hairline boundary, the title in capitals and one small red sector as the only colour. Content slides work as structured reports: a name in capitals, four fixed fields beneath it, and numbers in a monospaced face. Data slides suit tables and dot or line charts drawn with hairline axes and dashed gridlines, with red used only for the single value that crosses a threshold. A sequence of slides can follow a clockwise logic, with each slide naming its position in the round.
For web interfaces the style fits monitoring dashboards, status pages, logistics and operations tools, public data portals and documentation. A table of services with columns for status, load, region and latency can follow the four-part order directly; red fills a row only while an alert is active, and the rest remains ink on paper. Pricing pages benefit from the fixed-order discipline, because every plan lists the same fields in the same place and the reader compares without hunting. Navigation stays plain, set in capitals, with no icons beyond simple marks.
For editorial and marketing work the style suits reports, annual reviews, civic information and any brand that wants to sound dependable. Long articles can open with a four-line summary in the fixed order, and sections can be introduced by capital-letter labels. Photography is rare and kept secondary to diagrams and maps; where it is used, it should be restrained, without filters or heavy frames.
The common mistake is to take the nautical theme literally, adding anchors, ropes, waves or blue gradients. The style is about the chart and the bulletin, not about seaside decoration. The other mistake is to spend colour freely: if red appears on more than one thing at once, or for any reason other than a warning, the whole language breaks. Keep corners square, keep shadows out, and let colour mean exactly one thing.

Shipping Forecast — FAQ
Do I need a nautical theme to use this style?
No. The style borrows the discipline of the Shipping Forecast and the chart behind it, not the subject matter. It works for any content that benefits from a fixed order, hairline structure and scarce, meaningful colour, such as dashboards, reports, directories and status pages. Adding anchors or waves would actually weaken it by turning a system into a costume.
Why is red used only for gale warnings?
Because colour in this system is a message. On the source chart, red fills an area only while a gale warning is in force, so seeing red means one specific thing. If red is also used for branding, buttons or decoration, it loses that meaning. In an interface this translates to reserving red for the single condition that demands attention, such as an active alert or a breached limit.
How do I apply the four-part order to non-weather content?
Choose four fields that every item in your set can answer, fix their order, and never change it. A service might report status, load, region and latency; a product might report fit, material, price and availability. The point is that the reader learns the order once and then scans down a list without searching. Keep field labels short and set measured values in a monospaced face.
Why are there no rounded corners or shadows?
Because the source is a navigation chart and a safety bulletin. Rounded corners and soft shadows add visual information that means nothing, and on a chart anything meaningless might be mistaken for something meaningful. The style keeps surfaces flat and corners square so that every mark on the page has a job. It also keeps the look sober and consistent across print and screen.
Can this style work with a dark background?
The source is a paper chart, so it is conceived as a light style, and the meaning of white as deep open water is central to it. A dark variant is possible for night use, as charts and instruments have night modes, but the system must keep its rules: thin lines, scarce colour, and red reserved for warnings. If you invert, take care that the shallows and land tones still read as distinct from the ground.
Related design styles
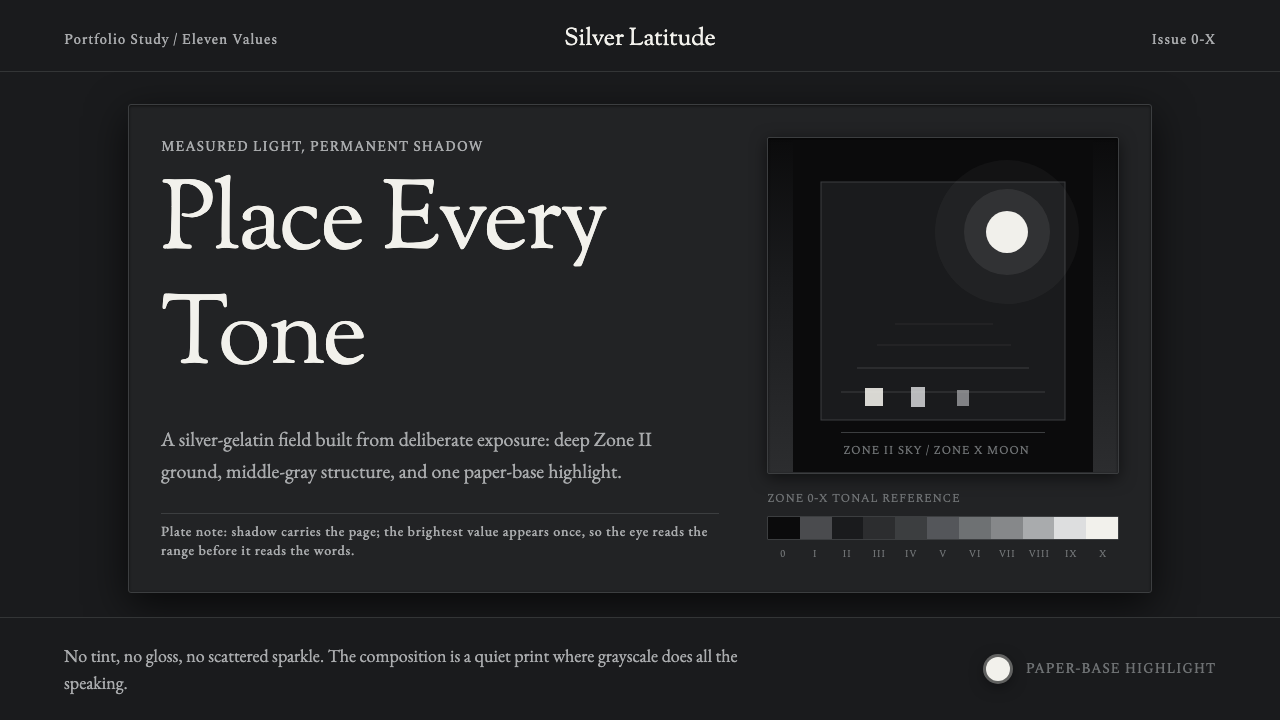 Ansel Adams Zone SystemOnly light remains. Deep shadow, serif captions, and one white moon mark the…
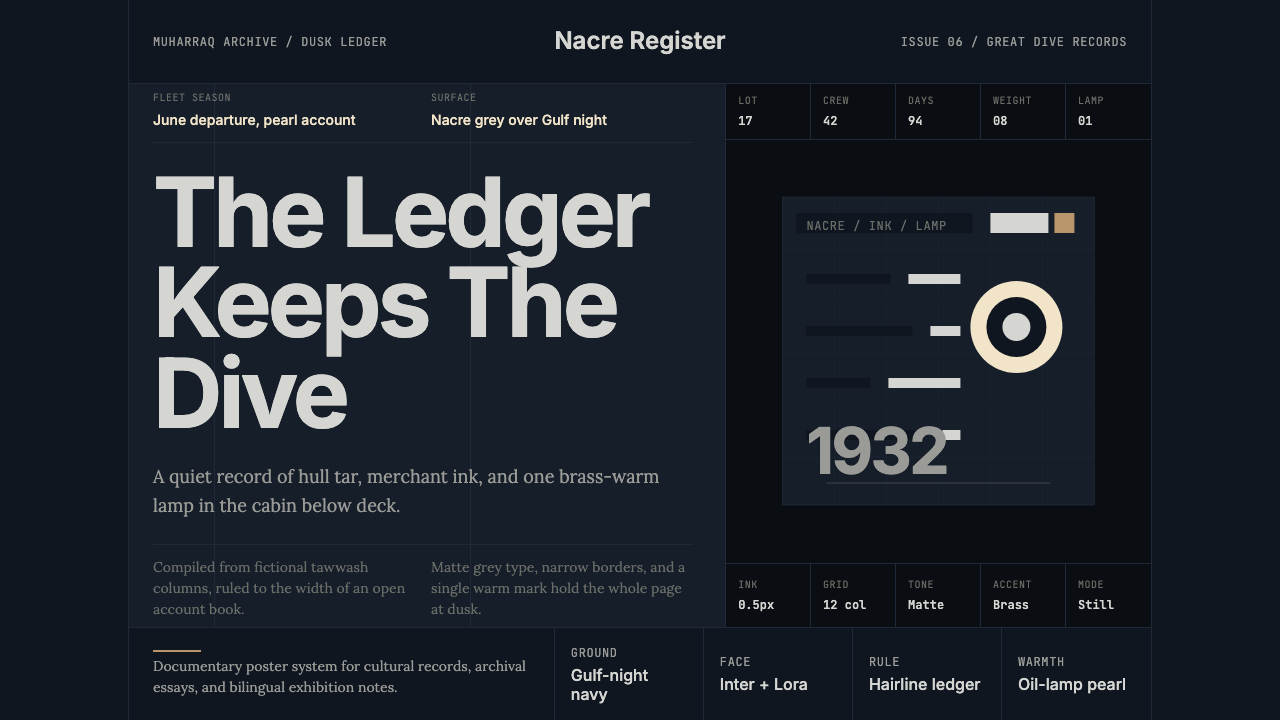 Bahraini Pearl Diving GreyQuiet authority at dusk. Nacre grey type and hairline grids hold one brass-wa…
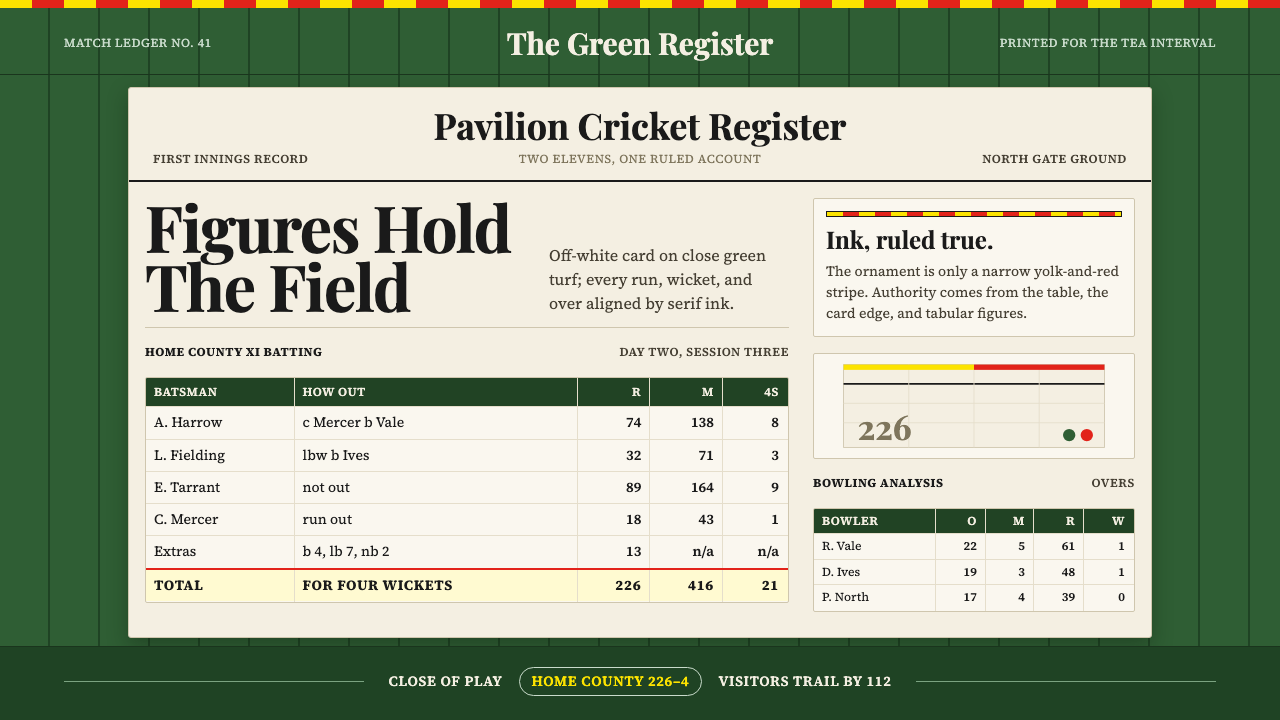 Cricket Test ScorecardQuiet authority in ink. Grass green field, off-white ledger, egg-and-bacon st…
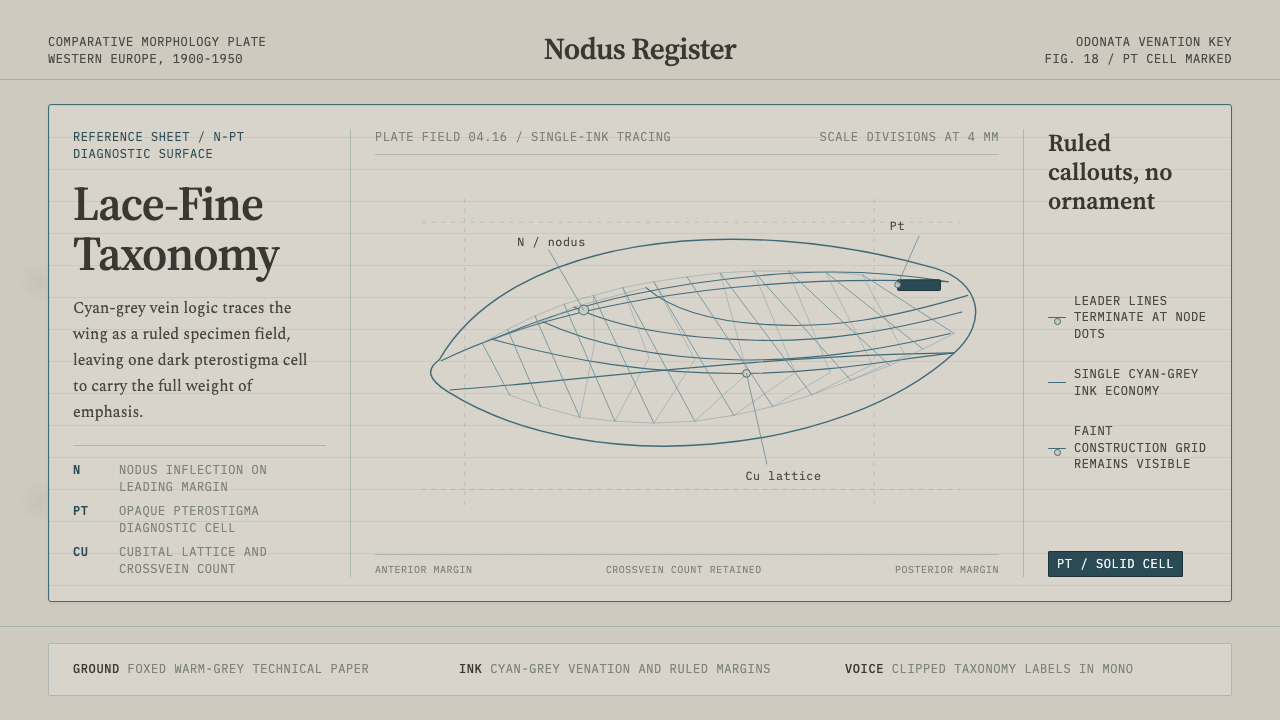 Dragonfly Wing VenationPrecision, nearly weightless. Cyan-grey veins rule a foxed paper taxonomy pla…
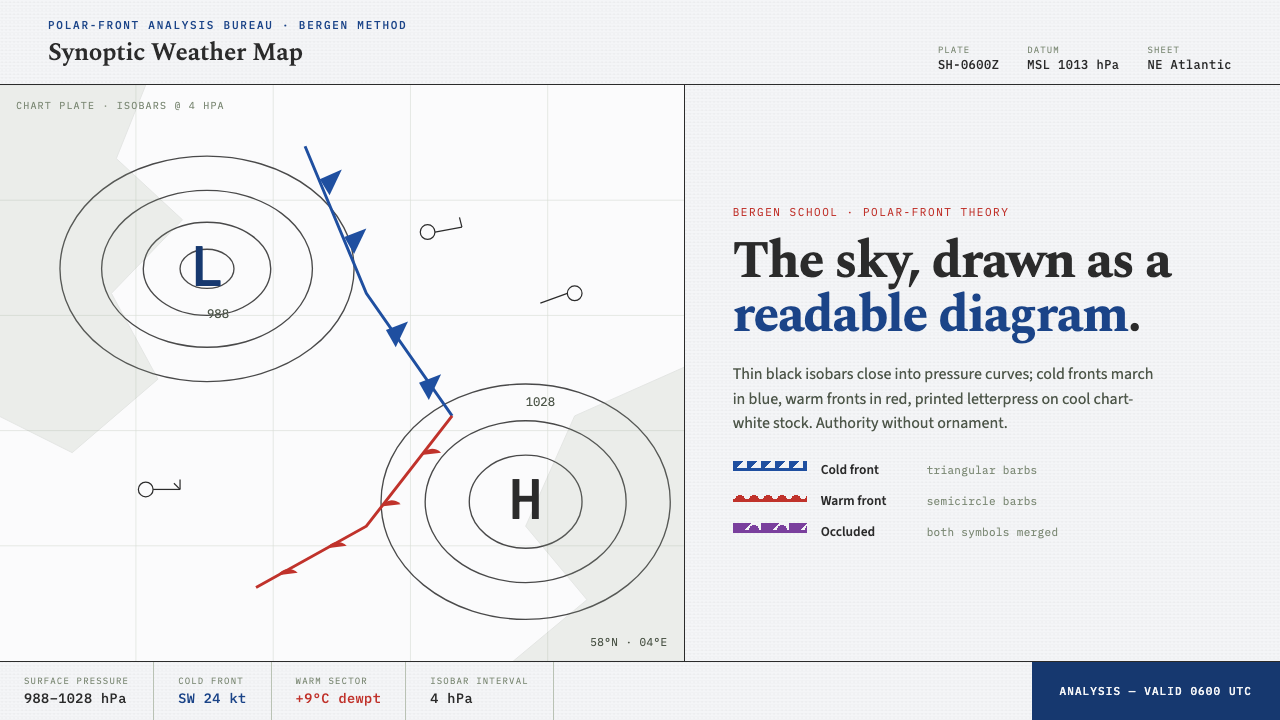 Synoptic Weather MapThe sky as a readable diagram. Black isobars, blue cold fronts, red warm fron…
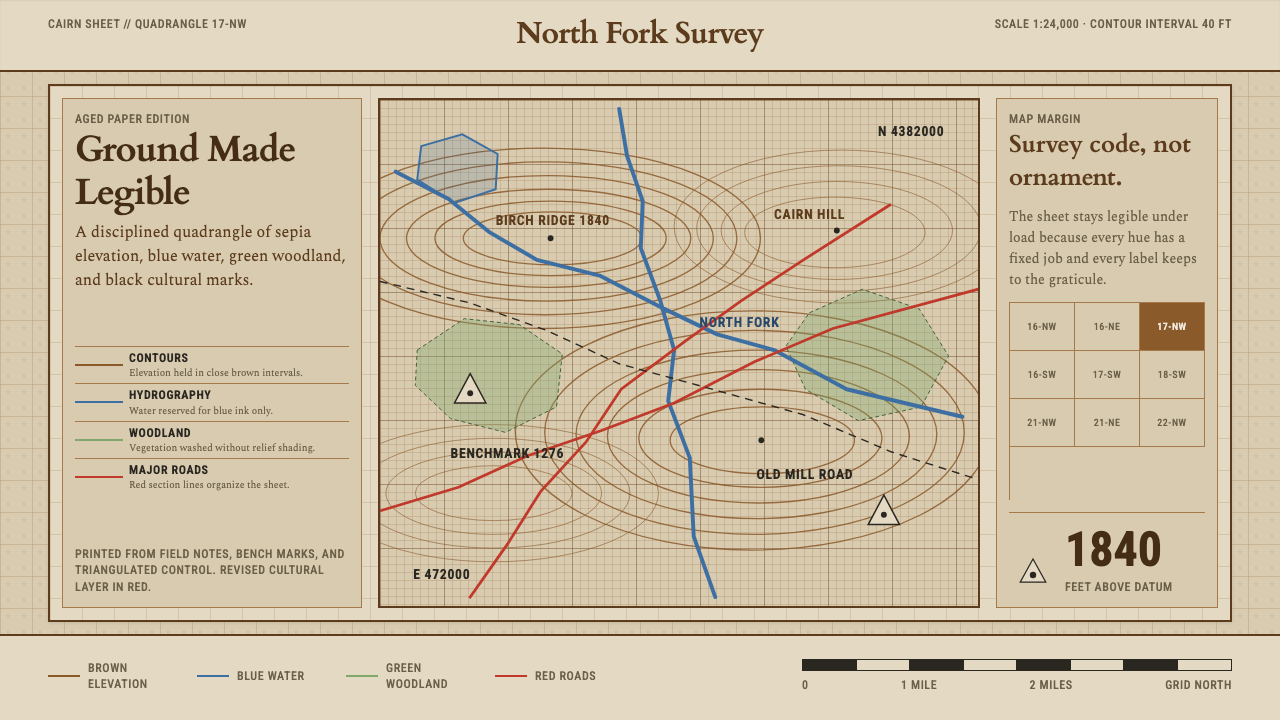 Topographic Survey MapMeasurement becomes beauty. Sepia contours and blue hydrography sit on aged m…