What is Sanborn Insurance Map?
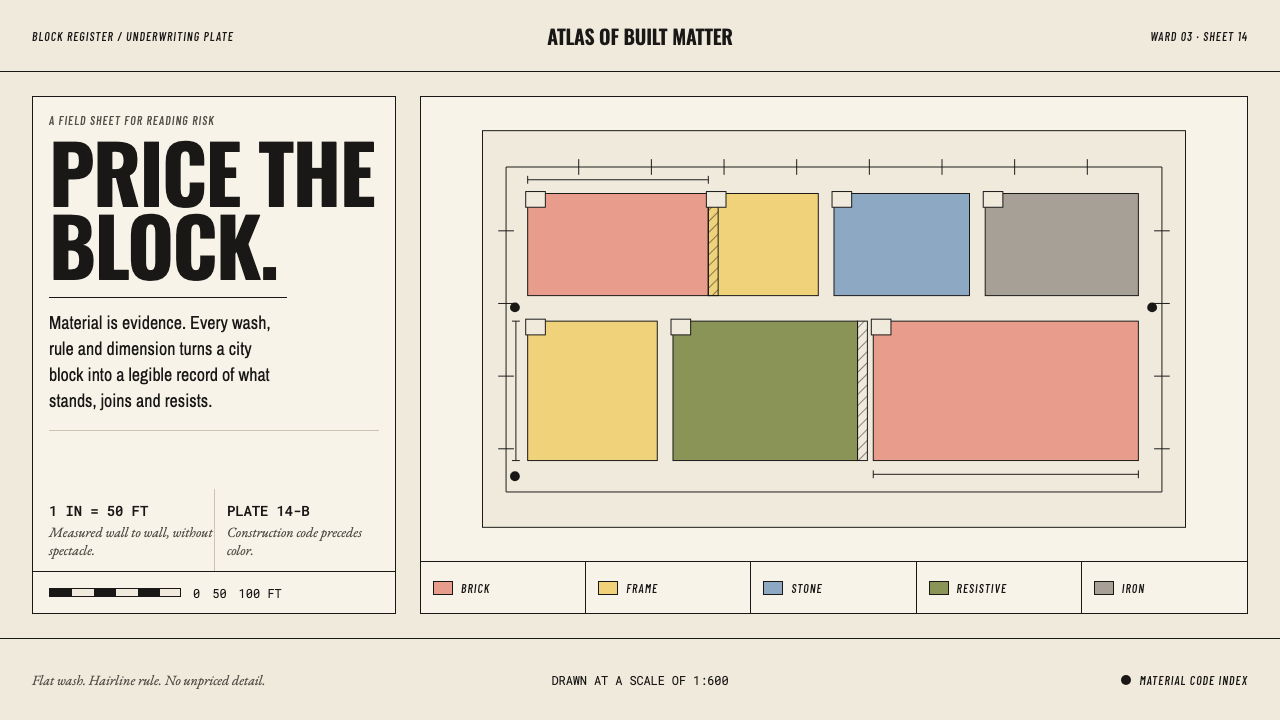
A Sanborn sheet was never meant to be admired; it was meant to be priced — and that is why every color, line and label on it has to mean something.
Sanborn Insurance Map in brief
The Sanborn Insurance Map style is a light-ground, documentary design language derived from the fire insurance atlases that surveyed American towns and cities from the nineteenth century into the mid-twentieth. Its visual identity is flat material color washes — pink, yellow, blue, olive and grey — laid over a pale sheet, with hairline rules, fine condensed lettering, small numerals set at building corners, and a short vocabulary of hatches and dots. It looks like a drawing because it is one, and like a spreadsheet because it behaves like one.
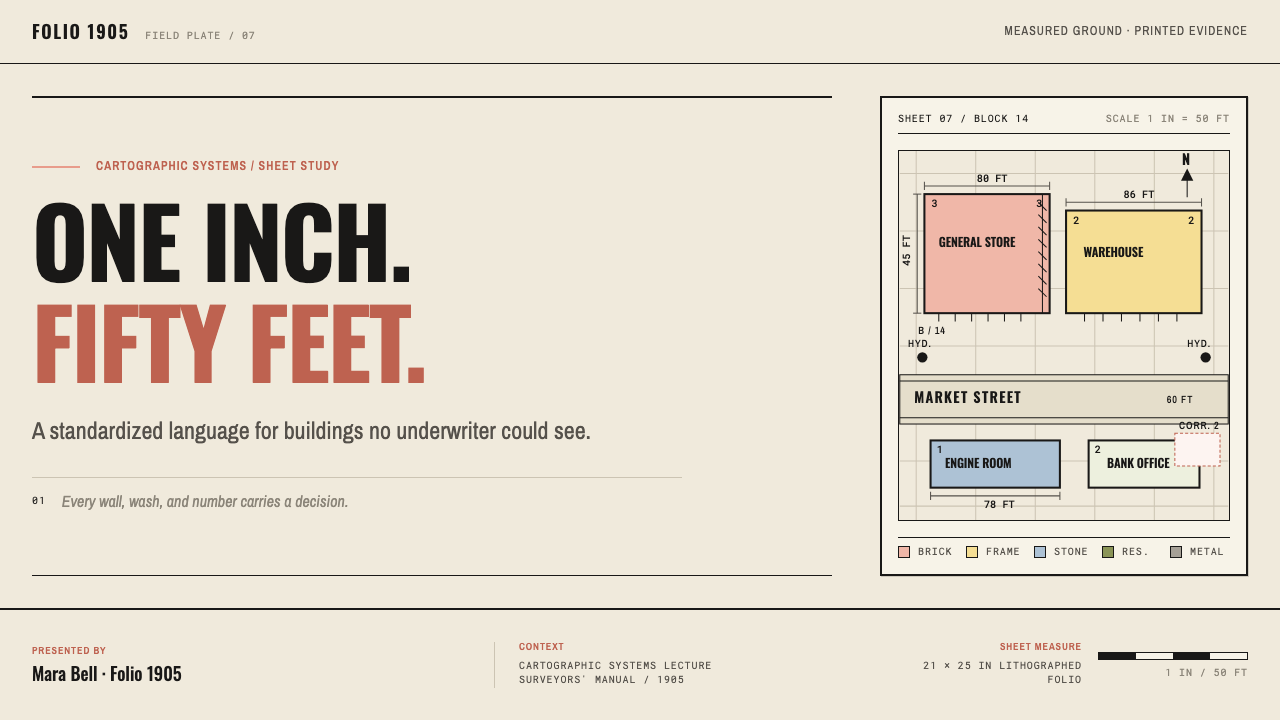
The central idea is that color is evidence. On a Sanborn sheet, pink meant brick, yellow meant wood frame, blue meant stone, olive meant fire-resistive construction and grey meant iron cladding. An underwriter reading a bound folio far from the town could look at a block drawn at one inch to fifty feet and read what each building was made of without ever visiting it. The colour was a material code before it was a colour. The style carries this over directly: hues are assigned meanings, applied as flat fills, and never used for mood.
Everything else follows from the same discipline. Storey counts sit at the corners of buildings. Dimensions run in feet along the wall lines. Firewalls are cross-hatched in six-inch increments. Hydrants are solid black dots. The lettering is fine condensed gothic, tightly set, because a label had to fit inside a footprint. Nothing is decorative, and nothing is there for atmosphere. The result is a style with unusual density and clarity: a lot of information, all of it in its place, all of it measurable.
Where does Sanborn Insurance Map come from?
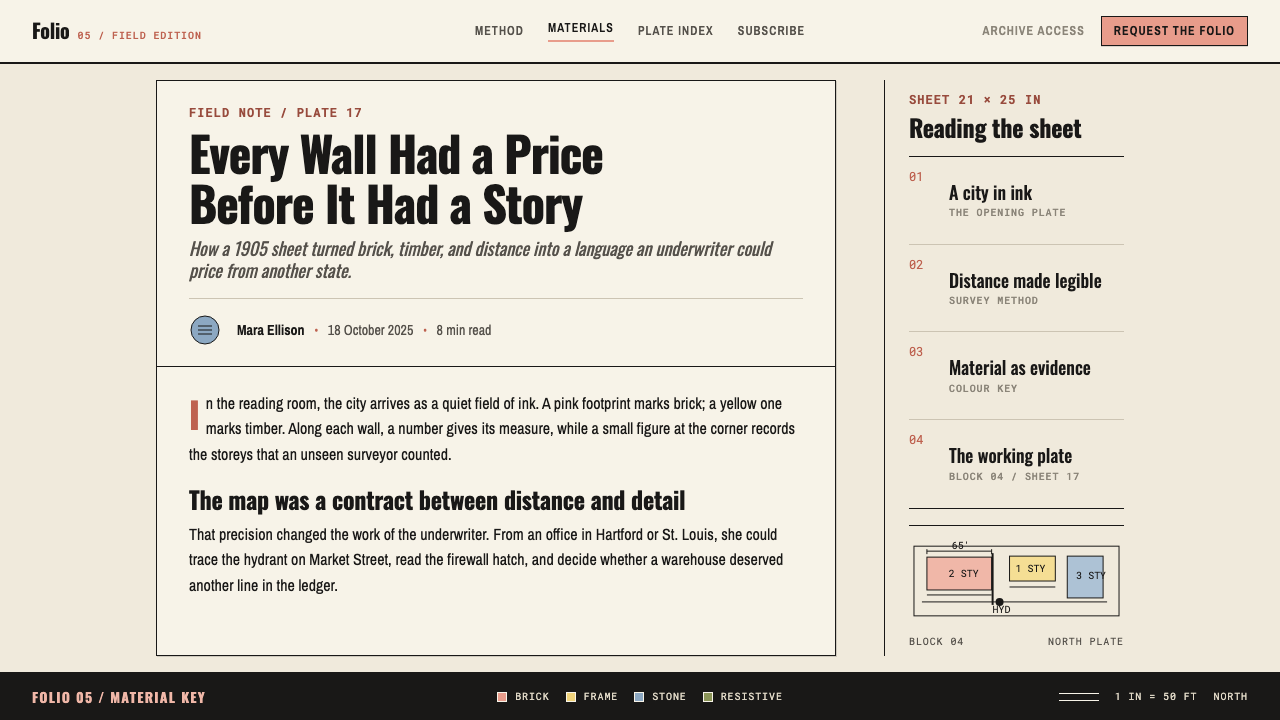
Fire insurance depended on knowing what was being insured. A company underwriting a building in a town it had never seen needed to know how the structure was built, how tall it was, what stood next to it, and what fire protection was nearby. The Sanborn maps answered that problem with a standardized drawing. The source tradition places the start of surveying in 1866 and names Daniel Alfred Sanborn as the figure behind it; over the following decades the work grew into an enterprise covering some twelve thousand cities and towns across the United States.
What made the sheets useful across so many towns was consistency. The conventions were fixed by the 1905 Surveyors' Manual, which set how materials were colored, how symbols were drawn and how labels were placed, and the same grammar then ran through the middle of the twentieth century. An underwriter who learned to read one town could read any other. The source material places the tradition at the intersection of fire underwriting cartography, large-scale urban survey drafting and hand-coloured lithography: printed linework, then color applied in a controlled, repeatable way across the sheet.
The reader shaped the look. The intended audience was a professional working at a desk, often in another state, who needed to assess risk from a bound volume and who would never walk the block. That reader needed a drawing that could be scanned quickly and trusted completely. This is why the sheets are flat rather than perspectival, why color is limited to a small meaningful set, and why lettering is condensed: every label had to fit inside the footprint of its building without crowding the next one. The style is a record of problem-solving under a very specific constraint, not a period fashion.
Today the sheets survive in large collections, and the Library of Congress, which holds many of them, appears among the key figures of this tradition for that reason. For designers, the lasting value of the Sanborn tradition is its discipline. It shows how a drawing can carry a great deal of data without becoming decorative, and how a limited set of fills, rules and marks can behave like a language. This design system adopts that discipline literally: flat fills, hairline rules, measured labels, nothing decorative. It is a style for information that has to be acted on.
What defines the Sanborn Insurance Map look?
Color as Material Code
Each hue stands for a construction material: pink for brick, yellow for wood frame, blue for stone, olive for fire-resistive construction and grey for iron cladding. The rule is one hue, one meaning. Color is applied to answer a question, never to create mood, and a legend should be as natural a part of the layout as a title.
Flat Washes
Fills are flat and even, in the manner of a hand-coloured lithograph: a clean wash of one hue within a defined outline, with no gradient, no texture and no glow. The washes are muted, slightly chalky and reconciled with the pale sheet beneath them, so color sits like pigment on paper rather than light on a screen.
Hairline Rules
Lines are as fine as a drafting pen can make them. Wall lines, lot boundaries and block edges are thin, even and continuous, so that fills and labels carry the visual weight. Heavier lines are used rarely and only to mean something, never to emphasize. The overall impression is of precision and restraint, a page that was drawn rather than designed.
Condensed Gothic Labels
Lettering is a fine, narrow sans-serif set tightly, because a label had to fit inside a footprint. Text is small, plain and upright, with no ornament, and often runs in short strings of letters and numbers. The condensed proportions are a functional choice that gives the style its recognizable rhythm: many small, compact words rather than a few large ones.
Measured Annotation
Numbers live on the drawing. Storey counts sit at the corners of buildings, and dimensions run in feet along the wall lines. Annotation is data in place, not a caption beside the illustration. A design that borrows this puts values directly next to the thing they describe and trusts the reader to scan.
Hatching and Marks
A small vocabulary of marks covers what color cannot. Firewalls are cross-hatched in six-inch increments, hydrants are solid black dots, and other features have their own small symbols. The vocabulary is deliberately short and consistent, so that anyone who learns it once can read every sheet. New symbols should be added reluctantly, and only when they carry real information.
Fixed Scale and Density
The sheets are drawn at a constant scale of one inch to fifty feet, so every block is comparable with every other. That fixed scale, together with flat fills and small labels, produces a dense but orderly page. Density is a feature here: a lot of reliable information in a small space, organized by the consistent structure of streets, blocks and building outlines.
Who shaped Sanborn Insurance Map?
The source tradition ties the start of surveying in 1866 to Daniel Alfred Sanborn, whose name the maps still carry. He represents the founding idea: that a systematic, repeatable survey of buildings could turn local observation into a record distant underwriters could trust. For designers, his legacy is less a look than a method: measure consistently, record in a fixed grammar, and make the result readable by someone who has never been there.
The surveyors were the largely anonymous workforce who walked the streets, measured the buildings and recorded materials, storey counts and fire-protection features such as hydrants across some twelve thousand American cities and towns. Their work is why the sheets were trusted: the conventions of the 1905 Surveyors' Manual were practiced by people who had stood in front of the buildings. They are the unnamed authors of the style's measured, observational tone.
The Library of Congress holds a large collection of Sanborn sheets and is listed among this tradition's key figures because it is where many readers now encounter them. It matters to designers as the institutional memory of the style: the sheets survive as accessible, studyable objects, so their color conventions, labels and hatching can be examined directly rather than reconstructed.
How do you use Sanborn Insurance Map today?
The Sanborn Insurance Map style is among the most useful for information-dense work, because it solves a problem most dashboards share: how to put a great deal of data in front of someone without making it noisy. The answer is to give every mark a meaning and refuse everything else. It suits contexts where accuracy, scannability and trust matter more than warmth or spectacle.
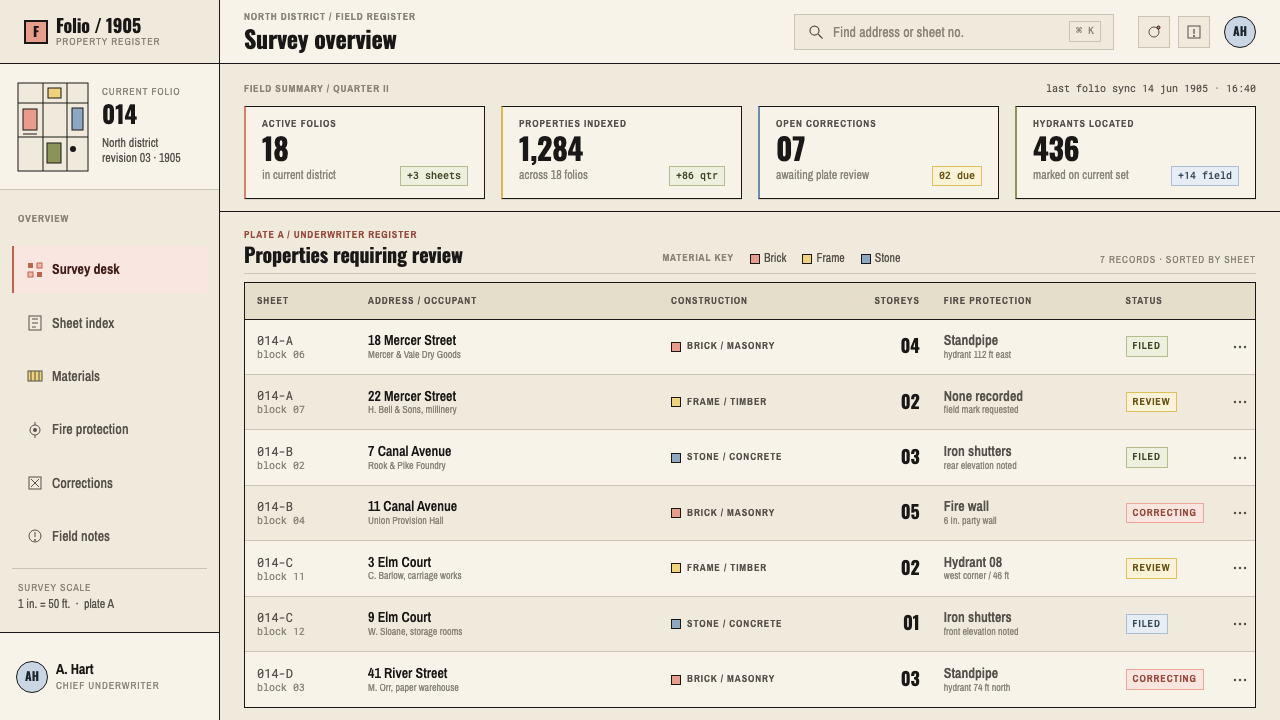
For presentation slides, the strongest use is the diagram or the plan. A cover can be a pale sheet with a block-like arrangement of flat colored rectangles and a short condensed title; content slides work as annotated plans, with small numerals at corners and a visible legend. Data slides should treat color as a key: each category gets one flat fill, repeated consistently across the deck, with values written directly on or beside the shapes instead of in separate callouts.
For web interfaces, the style fits operations dashboards, property, logistics, risk and compliance tools, internal admin panels and any product built around maps, floor plans or categorized inventory. Define a small set of status or category hues with fixed meanings, use hairline separators, set labels in a compact narrow face, and place values right next to the objects they describe. Hover states can reveal details rather than animate. Avoid shadows and rounded decoration; clear outlines and flat fills are enough.
For editorial and marketing work, the style suits data journalism, urban history, civic and architectural storytelling, and brands that want to project reliability, such as insurance, surveying, construction or archives. Annotated maps and diagrams read naturally, as do long captions that behave like survey notes. Marketing pages can use a plain pale ground with a handful of material-coded color blocks to explain a product structure, keeping copy short and factual.
The most common mistake is using the palette decoratively. Once pink and olive appear on a page for no reason, color stops being evidence and the style loses its meaning. The second mistake is sepia nostalgia: the original sheets were working tools, and an artificially aged, tea-stained look turns precision into costume. The third is breaking the scale: oversized labels, thick outlines and soft shadows all contradict the idea that every label fits inside its footprint. If a label does not fit, shorten the label rather than enlarging the box.
Sanborn Insurance Map — FAQ
What did the colors on a Sanborn map mean?
They coded the construction material of each building. Pink meant brick, yellow meant wood frame, blue meant stone, olive meant fire-resistive construction and grey meant iron cladding. The point was to let an underwriter read how a building was made from the page alone. In the design style, the same principle becomes a rule: one hue, one meaning, applied as a flat fill.
Is the style only suitable for maps?
No. Maps are its origin, but the underlying method works anywhere you need to show categorized, measured information: floor plans, inventories, network diagrams, status boards, schedules and reports. The method is flat color with fixed meaning, hairline rules, compact labels and data placed on the object it describes. Any product with those needs can use it.
How is it different from sepia vintage-map styles?
Vintage-map styles use age as atmosphere: warm stains, torn edges, decorative cartouches and ornamental lettering. Sanborn did none of that. Its sheets were working documents, and their look comes from function: flat material colors, fine condensed labels and a short vocabulary of marks. A faithful use is crisp and measured rather than nostalgic.
Can the palette be extended beyond the five material colors?
Yes, but only when a new color carries a new meaning. The style depends on the reader trusting that every hue is a code. Add a color when your data has a new category that must be distinguished, define it in the legend, and keep it as flat and muted as the rest. If a new hue is there just to add variety, leave it out.
Does it work in dark mode?
It is a light-ground style, and the chalky flat washes depend on a pale sheet beneath them. A dark version is possible if you keep the principle of fixed-meaning flat fills and hairline rules, but the muted material colors tend to look different on a dark ground and may need to be rebalanced. Test that each hue stays distinguishable from its neighbors before committing.
Related design styles
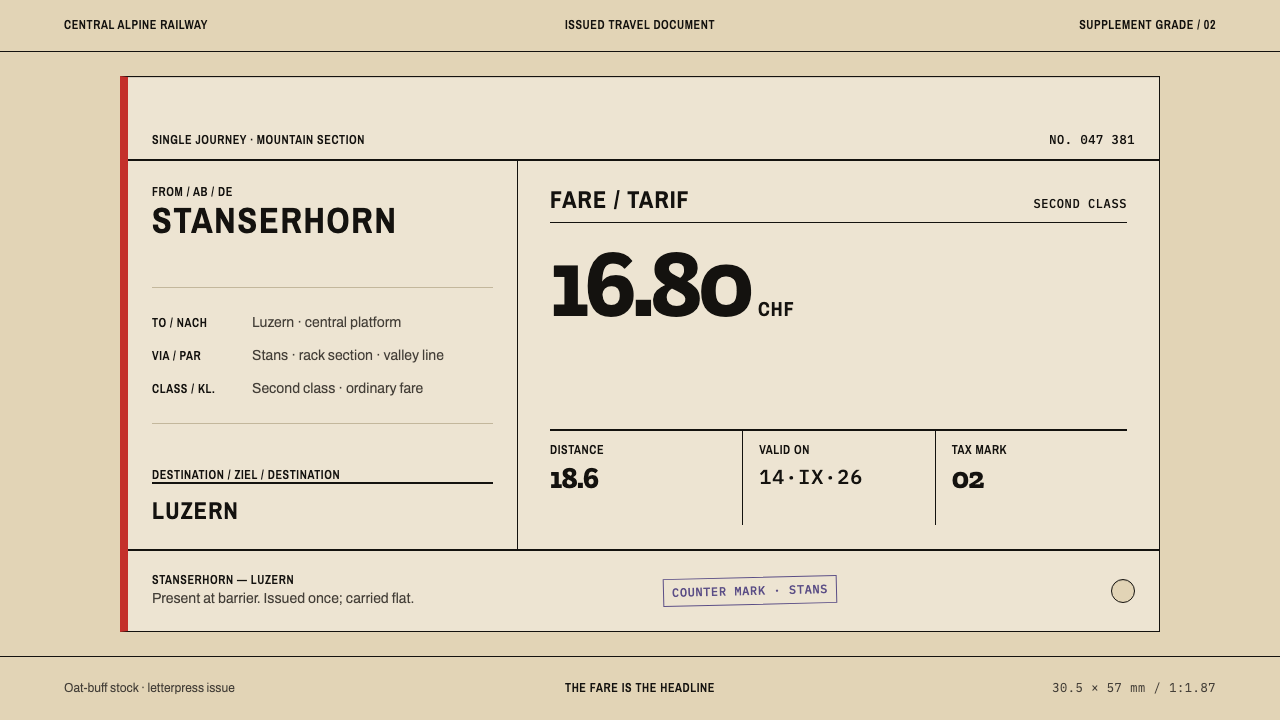 Alpine Funicular TicketIssued, not decorated. Oat-buff stock, slab fares and one longitudinal red st…
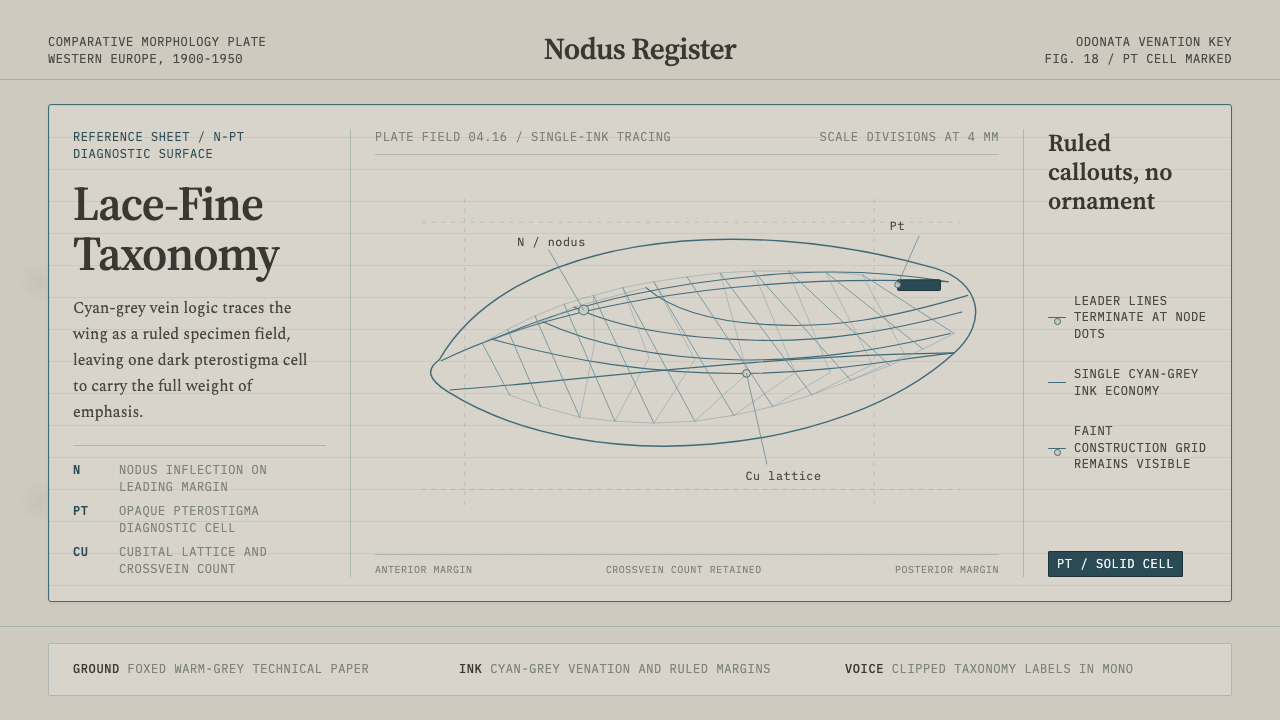 Dragonfly Wing VenationPrecision, nearly weightless. Cyan-grey veins rule a foxed paper taxonomy pla…
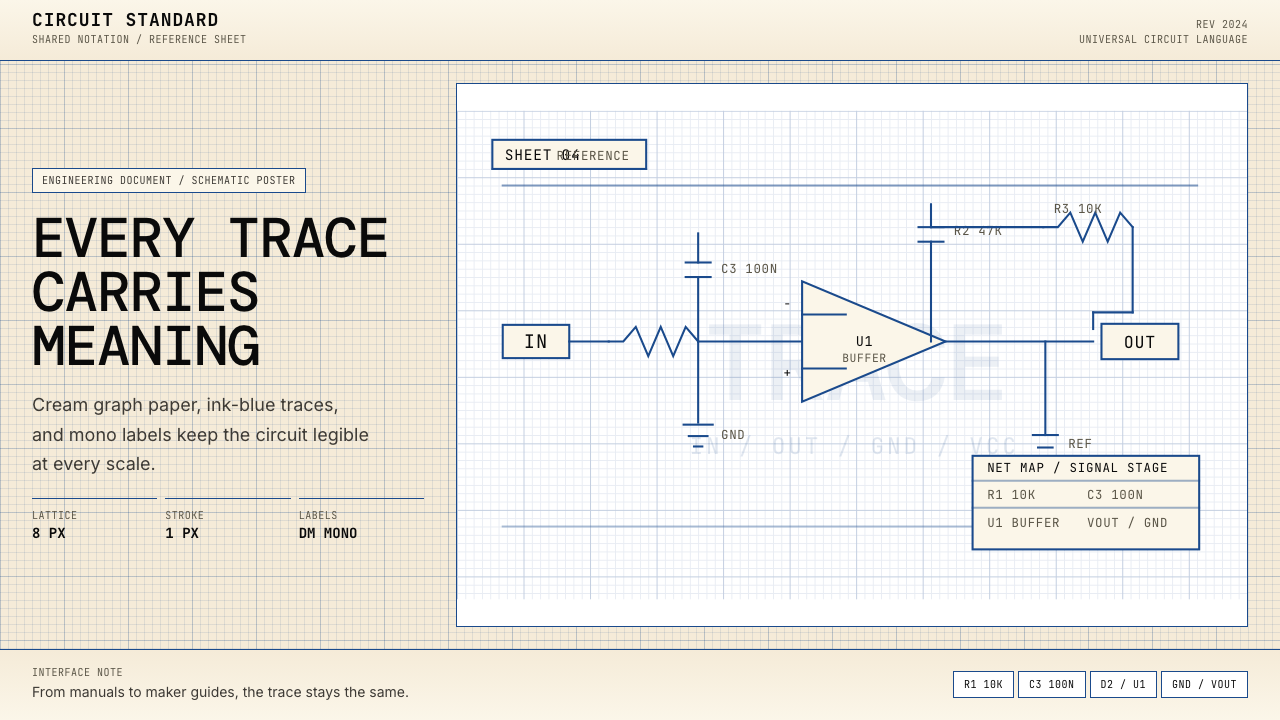 Electrical Schematic WiringAustere and exact. Cream graph paper, ink-blue traces, and mono labels make e…
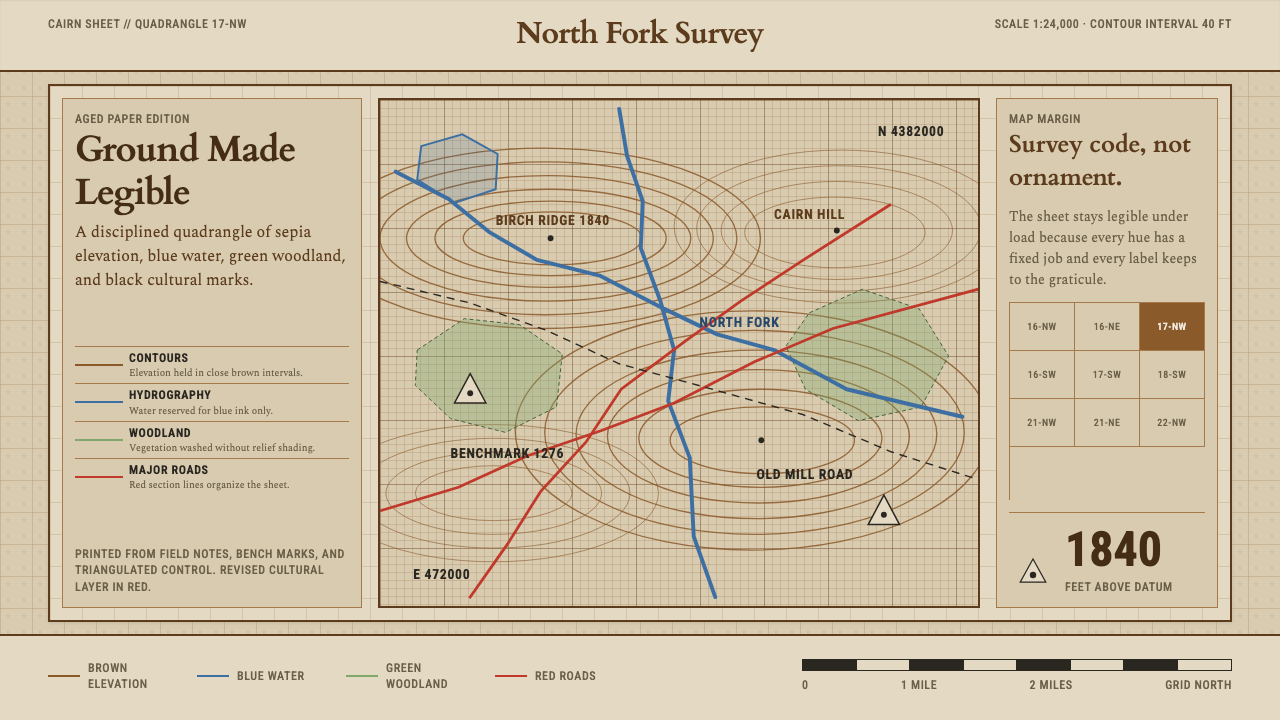 Topographic Survey MapMeasurement becomes beauty. Sepia contours and blue hydrography sit on aged m…
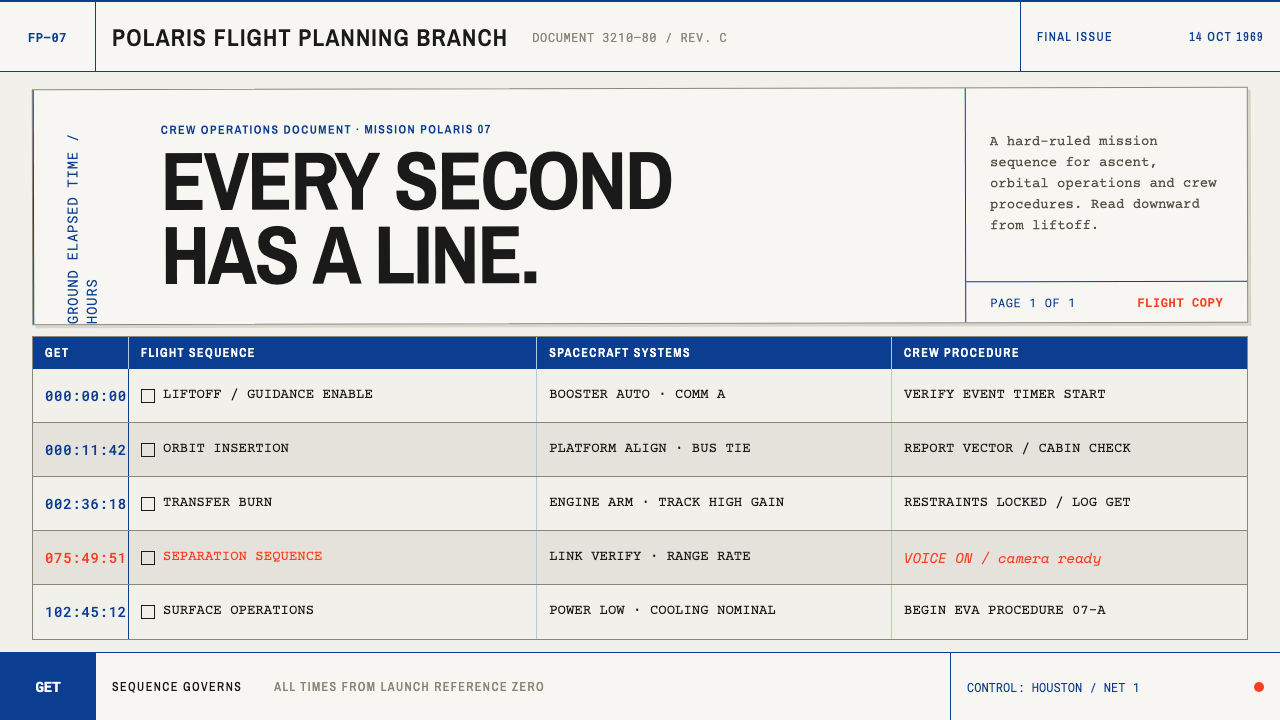 Apollo Flight PlanEvery second has a line. NASA blue rules and monospaced GET stamps discipline…
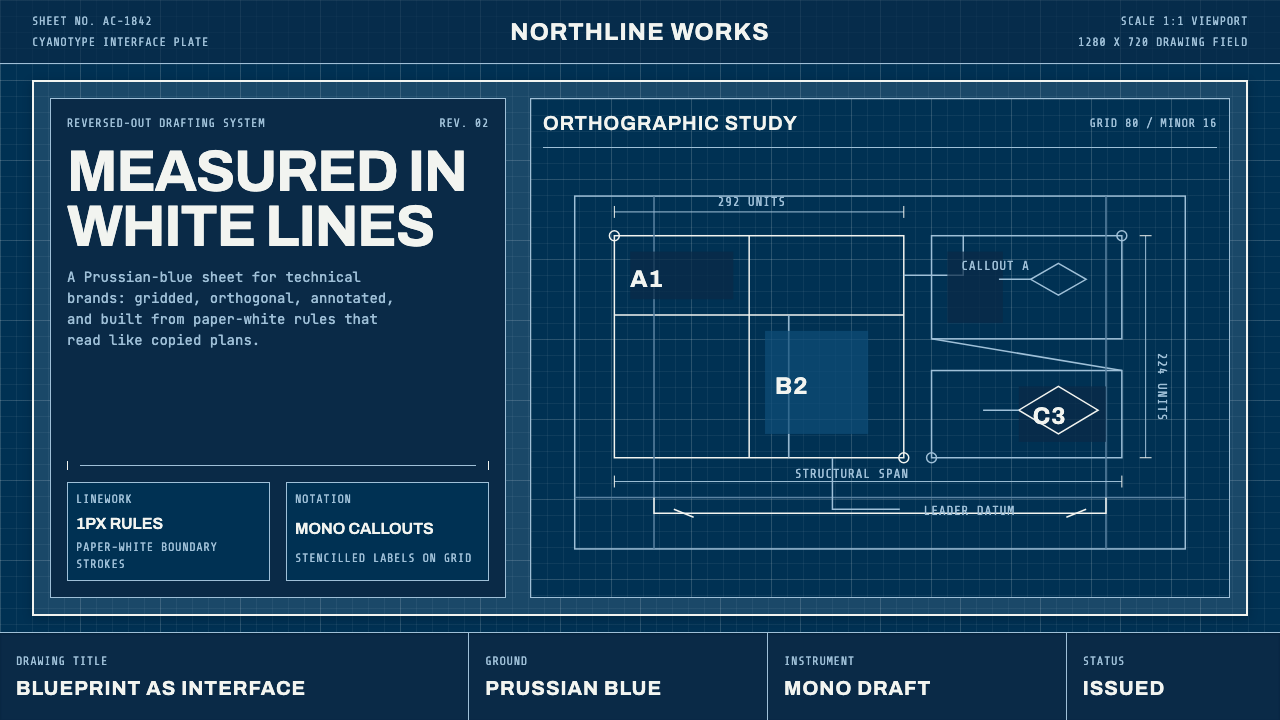 Architect CyanotypePrecision in negative. Prussian blue ground, paper-white grid, mono dimension…