What is Permafrost Monitoring Network?
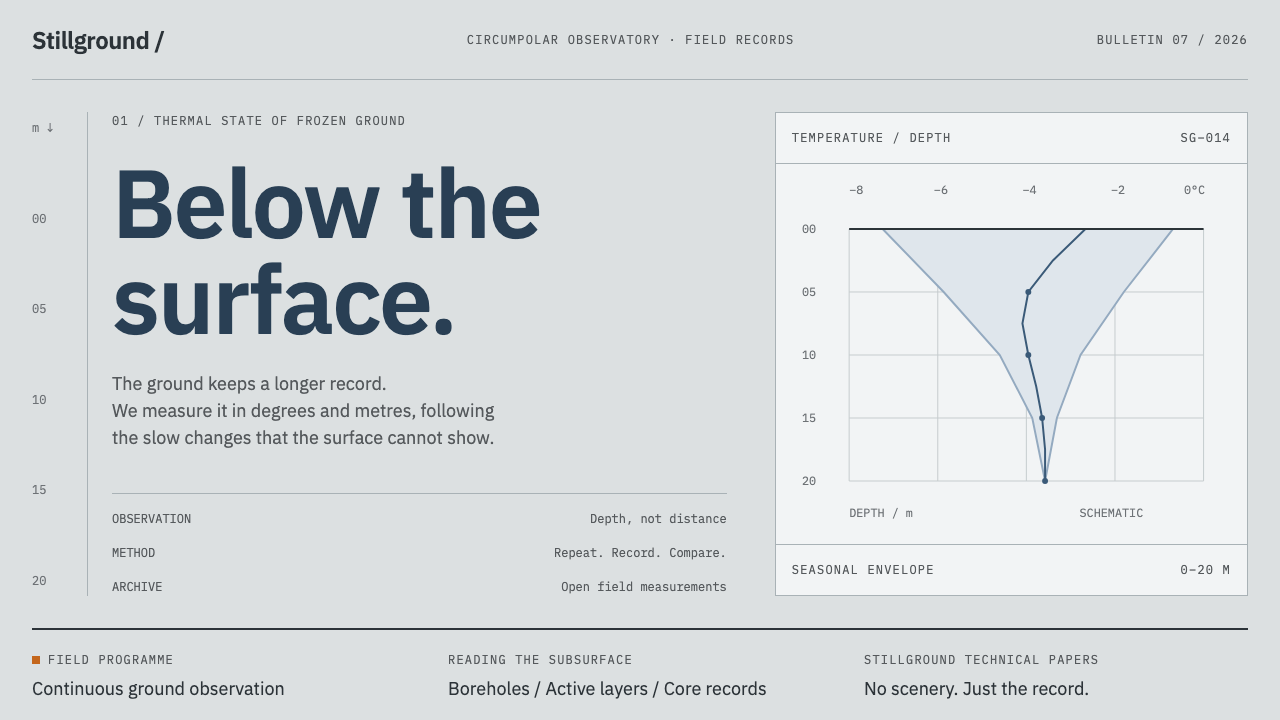
An interface built from permafrost measurement rather than Arctic scenery: overcast greys, sub-zero slate and depth running downward as the organising figure.
Permafrost Monitoring Network in brief
Permafrost Monitoring Network is a design style drawn from the Global Terrestrial Network for Permafrost, known as GTN-P, which keeps more than a thousand boreholes and some two hundred active-layer plots reporting from across the Arctic. Its visual language is scientific and unsaturated: overcast greys for the ground, a cool slate for the main colour, one warm orange kept for field equipment, fine rules and dense tables, and depth running downward as the figure that organises the page.
The style starts from a picture but is not about the picture. Its visual world is a retrogressive thaw slump on Herschel Island, where massive ground ice stands near-white against ice-rich frozen silt, ice wedges are cut open in section and everything sits under flat overcast. The output of the network, however, is not landscape. It is temperature-depth profiles, logger records, change detection on thermokarst lakes, charts, tables and core trays. The design system builds an interface out of those artefacts.
The result is a style of precision and patience. There is no directional light and no highlight, because the sky is overcast and the instruments do not care. The surface of the page is a line, the heavy mark where the measurements begin, and everything below it is data. Isotherms cut across the depth axis, fine rules carry the structure and tables are packed tight. Reading it feels like reading a field notebook that has been properly archived.

Where does Permafrost Monitoring Network come from?
The network at the centre of the style is the Global Terrestrial Network for Permafrost. Permafrost is ground that stays frozen for at least two years running, and it underlies much of the Arctic. Its top layer, the active layer, thaws each summer and freezes again each winter, and the depth of that thaw is one of the key quantities monitored. GTN-P keeps two kinds of record: temperature readings from boreholes drilled deep into the ground, and observations of active-layer thickness at long-running plots. Its database is held in Akureyri, in Iceland, and its archive is supported by the Alfred Wegener Institute in Potsdam.
The record dates the network's roots to two sources. The International Polar Year of 2007 to 2009 gave permafrost thermometry a coordinated push, and the plots known as CALM sites, short for Circumpolar Active Layer Monitoring, have been running since the early 1990s. The sites reach from northern Siberia and the North Slope of Alaska to Svalbard and the Yukon coast. The movements named in the record describe the toolkit: cryosphere monitoring networks, borehole thermometry, satellite change detection and open environmental data archiving.
The visual world comes from one specific place. At Herschel Island, off the Yukon coast, the coastal ground fails in slumps. Thawing ice-rich ground slides away and leaves a face where massive ground ice shows near-white against darker silt, and where ice wedges are visible in section. The palette of the style, pale ground ice, grey frozen silt and flat overcast, is taken from exposures like these, and the single warm orange is the colour of the drill rigs and field gear that appear against them.
Four names stand in the record: Vladimir Romanovsky, Jerry Brown, Hugues Lantuit and Guido Grosse. They represent two sides of the work, long-running field measurement and the remote-sensing and data research that has widened it. The ethos behind the network is that observations are a shared resource, archived openly and compared across decades. The design system turns that ethos into a visual rule: the interface should look like something that can be audited.
What defines the Permafrost Monitoring Network look?
Overcast greys
The ground is a family of unsaturated greys, the colour of a flat Arctic sky and of frozen silt under it. There is no warm cast and no tint to speak of. The greys step gently from the lightest page ground to mid-tone panels, so that structure can be shown by tone alone, and nothing on the page ever competes with the data.
Sub-zero slate
The main colour is a cool slate, close to the colour of cold ground and of ink on a printed section. It is used for data series, headings, active states and the heavy surface line. It has enough presence to read as the primary voice and not so much that it becomes a brand colour. Think of it as the colour of the line on the chart.
One warm orange
A single warm orange is held back for field kit, the drill rigs and equipment that stand against the grey ground. In an interface it marks where an instrument or a site is, a device marker, a field-team note or the one record that needs a human to look. Used sparingly it works like a hi-vis jacket in the landscape. Used widely, it turns into decoration.
Depth as organising figure
Depth runs downward and organises the page. The ground surface is at the top and values are read as you go down, so the vertical axis carries order, not just space. Profiles, boreholes and tables are arranged to be read top to bottom, and sections of a page can behave like layers. When depth runs upward or sideways, the style loses its reason for being.
Surface line and isotherms
The ground surface is a single heavy line, and everything is measured from it. Isotherms, lines of equal temperature, cross the depth axis horizontally in lighter weight. Together they form the page's basic grid: one strong mark that says where the surface is, and a set of fainter lines that say how the ground behaves below it.
Hairline rules and dense tables
Structure is carried by very fine rules and by tables that are set closely, with small figures and tight rows. The density is deliberate: a monitoring record is meant to be scanned for pattern and compared across stations, not browsed. Cards, big padding and soft containers dilute that. The page should feel like an instrument panel and a ledger at once.
Flat, directionless light
The light is overcast: even, shadowless and without highlights. There are no drop shadows, glows or glossy reflections, and depth is communicated by position and tone rather than lighting. This is not coldness for its own sake. It is the honesty of a record that must look the same on any day it is consulted.

Who shaped Permafrost Monitoring Network?
Vladimir Romanovsky is one of the four names in the record and is associated with borehole thermometry, the measurement of ground temperature at depth. That is the technique behind the temperature-depth profile, the style's central chart form. His place in the lineage explains why the design system treats a vertical profile as the natural way to show what permafrost is doing.
Jerry Brown is associated with the active-layer plots, the CALM sites that the record dates to the early 1990s. Those plots measure how deep the surface layer thaws each summer, which is why the style pays such attention to the surface line. His name also stands for the long view: observations kept steadily for decades are what give the network its value.
Hugues Lantuit is associated with the Alfred Wegener Institute in Potsdam and with research on the Yukon coast and Herschel Island, the very place that supplies the style's visual world. His name connects the abstract interface to the real exposure, the thaw slump and ice wedges, and reminds designers that the greys and slates are taken from an actual shoreline.
Guido Grosse is also associated with the Alfred Wegener Institute in Potsdam, and with thermokarst and the use of satellite imagery to detect change in the landscape. His field stands behind the before-and-after comparisons of thermokarst lakes that the record lists among the network's outputs, and behind the idea that an image can be data as much as a table of numbers.
How do you use Permafrost Monitoring Network today?
Permafrost Monitoring Network suits data-rich, evidence-first work: scientific and environmental reporting, monitoring dashboards, geospatial and infrastructure tools, research archives, open-data portals and climate or resource briefings. It is a style for audiences who will read tables and compare values, and it earns trust through rigour rather than warmth. It is a poor fit for consumer lifestyle brands or for any context that depends on emotional appeal and bright, welcoming surfaces.
In presentation slides, a cover can be a grey ground with a heavy surface line crossing the upper third and the title above it, with fine depth marks running down the margin. Content slides can be organised as layers, each section a deeper level. Data slides are where the style is strongest: temperature-depth profiles with depth running down the vertical axis, a single slate series, isotherms as fainter lines and orange used only to flag a site or an instrument. Resist the urge to decorate.
On the web, the natural homes are dashboards, data portals, monitoring consoles and research archives. Use a dense table as the core component, with fine rules between rows and sticky headers. Charts should place depth on the vertical axis. Show status through tonal steps of slate and grey rather than through traffic-light colours, and keep the single orange for devices, sites and field notes. Navigation can be as plain as a column of text labels beside the data.
For editorial and reporting work, the style supports scientific reports, policy briefs, data journalism and documentation for open datasets. Pair narrow text columns with wide figures, set captions in small type with the source stated plainly, and use footnote-like annotations. Photographs of cores or exposures can sit in flat grey frames, and a change-detection pair, before and after, is a strong way to show an effect without any rhetorical flourish.
The most common mistake is to dress the style in Arctic cliché: snowflakes, aurora gradients, ice-blue glows and polar-bear icons. These replace measurement with scenery, which is the opposite of what the system is about. Other errors include saturated alarm colours that break the unsaturated palette, adding a second accent beside the orange, softening the page with large cards and shadows, and reversing the depth axis. The page should look like a record that someone could check.

Permafrost Monitoring Network — FAQ
What is GTN-P?
GTN-P is the Global Terrestrial Network for Permafrost. It keeps more than a thousand boreholes and some two hundred active-layer plots reporting from across the Arctic, with its database held in Akureyri, Iceland, and its archive supported by the Alfred Wegener Institute in Potsdam. This design style takes its structure and its outputs, profiles, logger records and tables, as the basis for an interface.
Is this a landscape or photography style?
No. The palette is taken from a landscape, a thaw slump at Herschel Island, but the output of the network is measurement, and the style follows the output. Its characteristic forms are the temperature-depth profile, the dense table, the fine rule and the logger record. Photographs appear as evidence, in flat frames, not as atmospheric hero images.
Why is depth the organising idea?
Because depth is how permafrost is understood. Temperatures are measured at increasing depth in a borehole, and the active layer is defined by how far down the thaw reaches. Making depth run downward gives the page a physical logic: the surface is at the top, order matters and each row is a layer. It also turns a vertical scroll into something meaningful.
Why only one warm colour?
The orange is reserved for field kit, the drill rigs and equipment that stand against the grey ground. Keeping it to one use means that when it appears it means something: an instrument, a site, a note from the field. Introducing a second accent, or spreading the orange across decoration, removes that meaning and breaks the unsaturated character of the palette.
Does it only suit climate or Arctic subjects?
No. Any content whose natural structure is a record of measurements along a vertical or layered dimension can use it: soil and geology, oceanography, building diagnostics, drilling and well logs, even software stacks and layered systems. The Arctic is the source of the palette, not the limit of the subject. What matters is that the content is evidence to be read and compared.
Related design styles
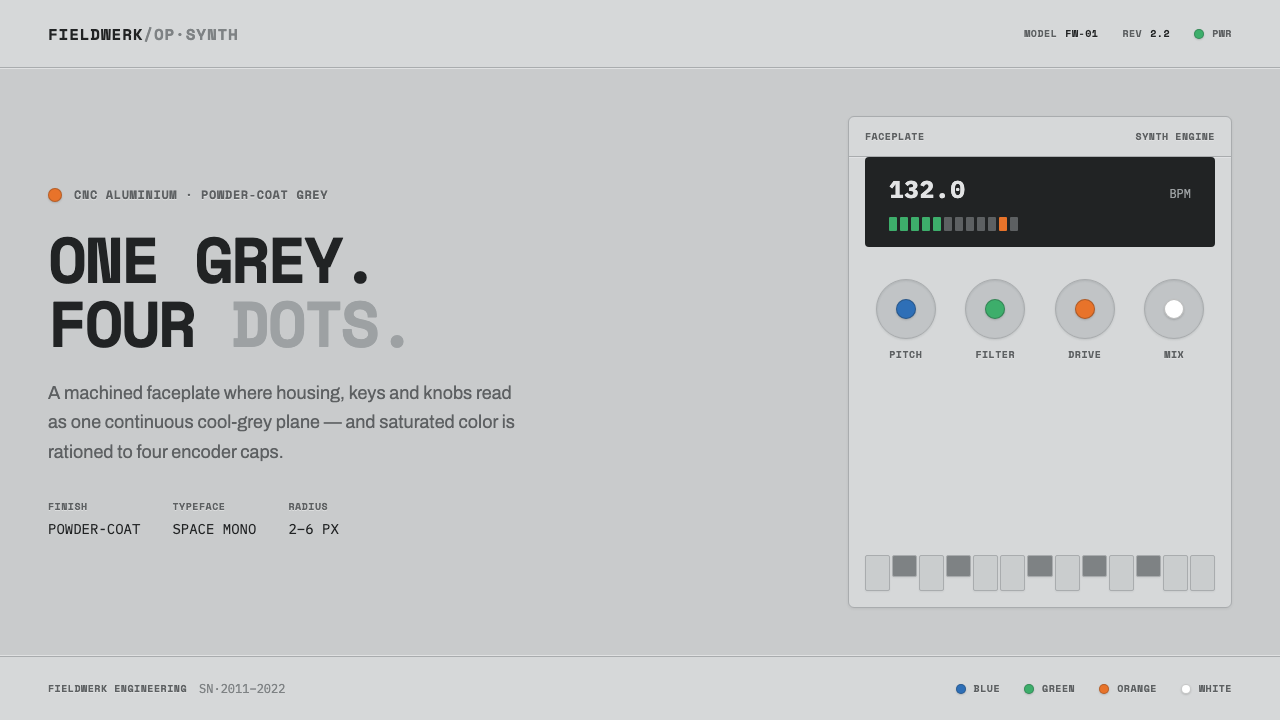 Teenage Engineering OP-1One grey, four dots. Machined aluminium in Space Mono, color rationed to tiny…
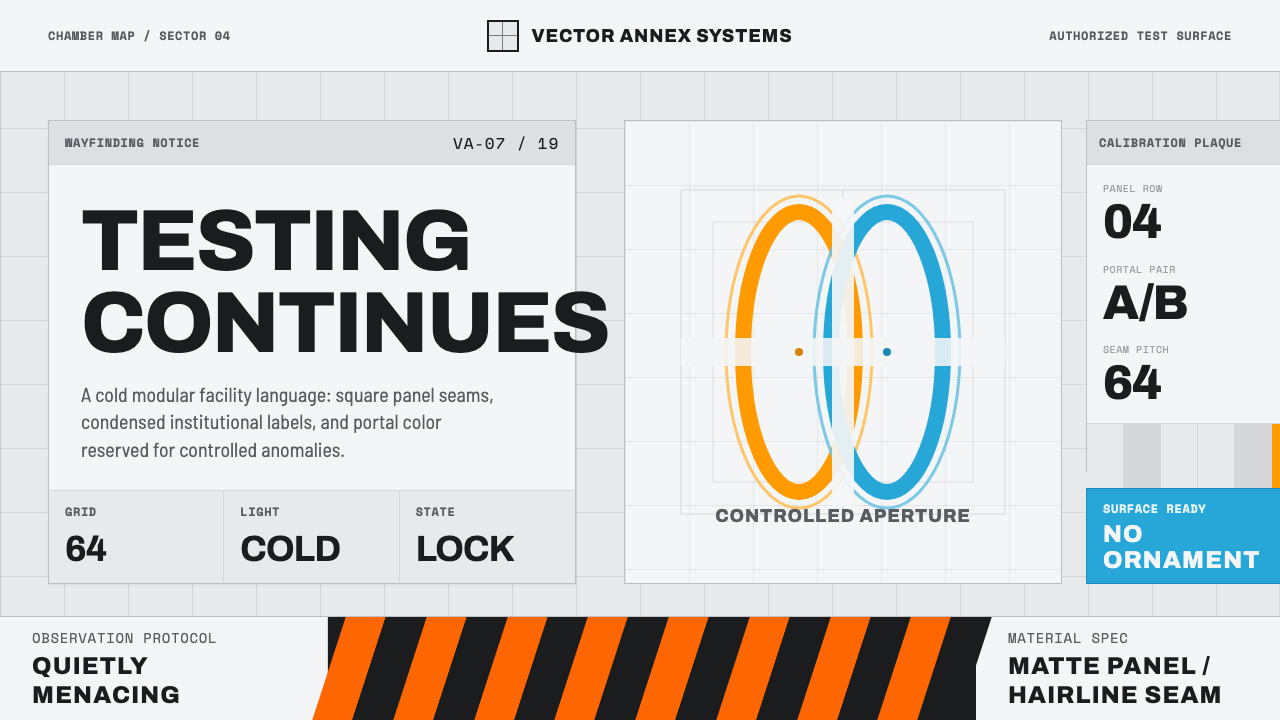 Aperture ScienceSterile authority. Cool panel seams, Archivo signage, and sparse orange-blue…
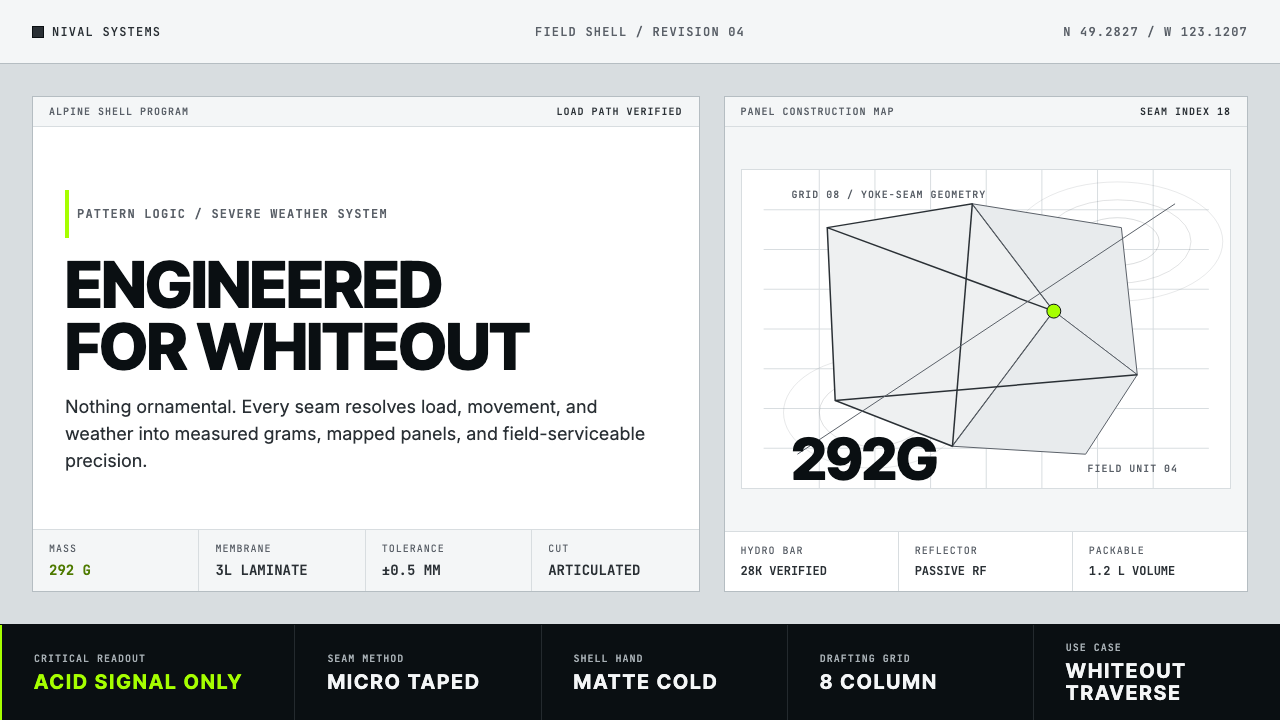 Arc'teryx Technical OutdoorEngineered, never ornamental. Glacier silver grid, mono specs, one acid-green…
 Cloud Brightening FleetBrightening becomes evidence. White ship-track lines score a cool-grey satell…
 Cron CalendarDesigner-tech restraint. Purple wash, ink grid, mono shortcuts, surgical even…
 GitHub DarkCode-first darkness. Cool-blue canvas, 1px borders, green/red diff lines.