What is Our World in Data?
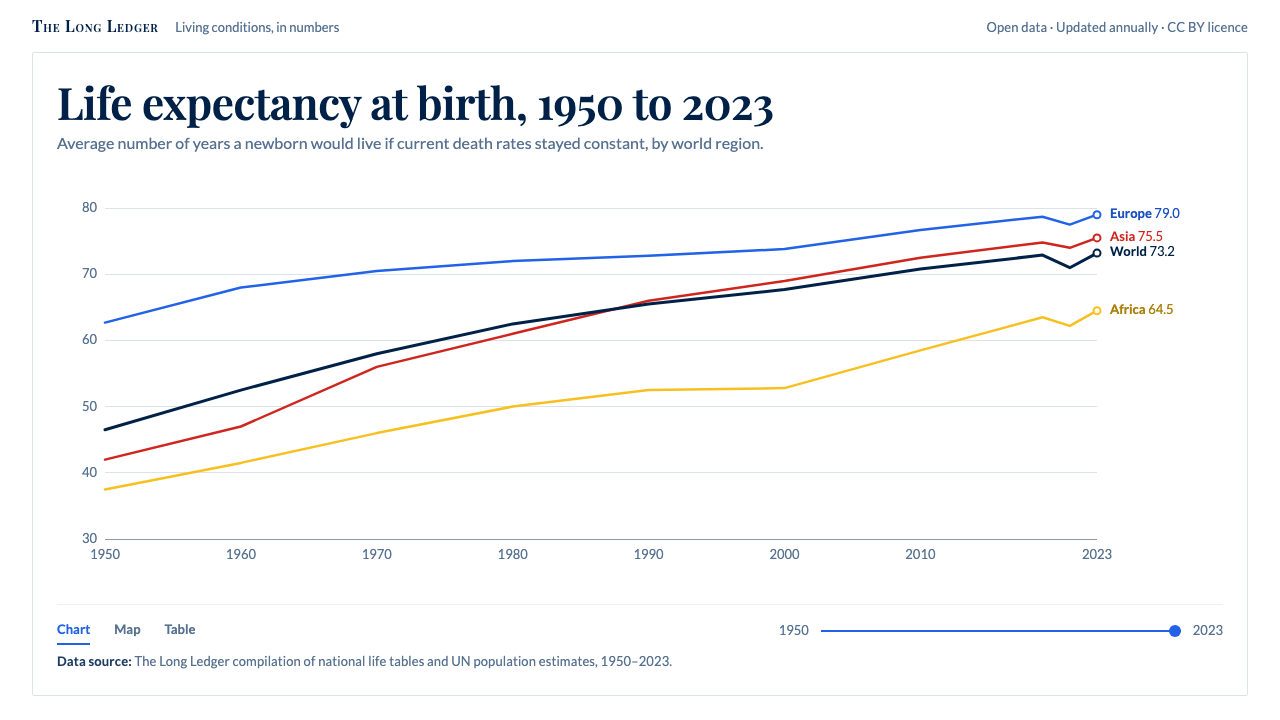
Our World in Data treats a chart as an argument that must show its working: thin lines named at their ends, white space, and a source printed under every figure.
Our World in Data in brief
Our World in Data is a visual language for presenting long-run statistics: how health, poverty, energy, food and population have changed across centuries and across countries. It began as a publishing project at the University of Oxford and grew into one of the most recognisable looks in open-data journalism. The look is a white canvas, Oxford-blue text, thin coloured lines, a pale-to-deep blue world map and a time slider along the bottom edge.
What sets the style apart is that provenance is part of the picture. Every chart names its source, its unit and its years, and that line of small print sits directly under the figure rather than in an appendix. The designer's job is not to make the data feel dramatic but to make it checkable. Anything that does not help a reader verify or understand a number is removed.
Typographically the system is a deliberate pairing. A serif, Playfair Display, sets chart titles and headlines, giving them the gravity of a printed reference book. Lato, a clear humanist sans-serif, carries every axis label, number and caption. The split is functional: the serif announces what the chart is about, the sans-serif is for reading values off it.

Where does Our World in Data come from?
The project was founded in 2014 at the Oxford Martin School, part of the University of Oxford, by Max Roser. His ambition was plain: show how living conditions have changed across the world over centuries, and let anyone check the numbers. At that point most public discussion of global progress and global problems relied on a single striking statistic quoted without context. The founding idea was to replace the isolated number with the long time series and to publish the underlying data alongside it.
The early site was built around a small team of researchers who gathered figures from national statistics offices, international agencies and academic datasets, then reconciled them into one consistent set of charts. Hannah Ritchie, Esteban Ortiz-Ospina and Edouard Mathieu are among the people most closely associated with the work as it grew. Over time the editorial output expanded from a few topic pages into a large catalogue of interactive charts that other publishers embed freely.
The organisational structure changed in 2019, when the publication became part of the Global Change Data Lab, a non-profit set up to run the project and keep its data and tools open. That step matters for the look. A site meant to be quoted and embedded by newspapers, schools and governments needs a visual identity that survives being dropped into someone else's page, and a restrained white-and-blue system travels far better than a loud one.
Visually the style sits in a lineage of quantitative minimalism. Source material for this system lists open-data journalism, long-run quantitative history and Tufte-style chart minimalism as its movements. From the Tufte tradition it inherits the habit of removing chart junk and labelling lines directly instead of sending the eye to a legend. From long-run quantitative history it takes the conviction that the time axis should be as long as the evidence allows. The current Grapher visual, the interactive charting tool at the heart of the site, settled into the form described here in the early 2020s.
What defines the Our World in Data look?
Color
The page is white, and the text is a deep Oxford blue instead of pure black, which softens long reading without losing contrast. Data is carried by a small family of muted hues, each assigned to one country, region or category and kept consistent across charts. The world map runs from pale blue to deep navy in clearly separated steps, and every step is tied to a labelled scale. Colour encodes quantity; it is never used as mood.
Typography
A serif for titles, a humanist sans-serif for everything else. Playfair Display gives chart headlines contrast and authority, while Lato keeps axis ticks, tooltips and footnotes calm and legible at small sizes. Titles are written as plain sentences that state the finding or the question, and subtitles specify the measure and the period. Numbers are set so they can be compared down a column without effort.
Direct Labelling
Series names sit at the end of each line, in the line's own colour, instead of in a separate legend. The reader never has to match a swatch to a name across the page. When lines crowd together the labels are nudged apart rather than hidden, and a hover reveals the exact value. This is the single most characteristic habit of the style and the first thing to preserve when you imitate it.
Thin Lines and Quiet Grids
Data lines are thin, which lets many series coexist without turning into a tangle, and markers appear only where a data point deserves attention. Gridlines are pale and sparse, there is no box around the plot, and axes are reduced to a few well-chosen ticks. Chart furniture is present only to support reading. Nothing has a drop shadow, a gradient or a three-dimensional bevel.
Source Lines and Metadata
Under each figure runs a footer that names the data source, the licence and the years covered, with a link to the underlying table. The footer is typeset as a regular part of the chart, not as a disclaimer. This is the structural feature that distinguishes the style from a generic minimal chart: remove the source line and you have taken away what the system is actually about.
Time Slider and Interaction
A slider along the bottom lets the reader move through years, and the same chart can switch between line, map and table views without changing its logic. Interaction is functional and visible: handles are plain, the current year is stated in text, and nothing animates for its own sake. The aim is to let readers test their own questions against the data.

Who shaped Our World in Data?
Founder of Our World in Data, who started the project at the Oxford Martin School in 2014. His insistence that statements about global change be backed by a visible long-run series set the editorial and visual rules the style still follows.
A researcher and writer closely associated with the project as it grew. Her explanatory writing on energy, environment and food helped turn the chart library into something general readers could follow.
Another of the core people connected with the research team. His name appears alongside the work on living-standards topics that established the site's reputation for careful data handling.
Associated with the project's data and engineering side as the charts and the Grapher tool matured. People in this role are why a chart on the site stays live, updatable and embeddable rather than becoming a static image.
How do you use Our World in Data today?
The Our World in Data style suits any material whose credibility depends on showing where a number came from. That includes research reports, policy briefings, data journalism, annual reviews and public-sector dashboards. It is a poor fit for work that wants to feel loud, playful or promotional, because its whole manner is quiet confidence.
For presentation slides, build the cover as a plain white page with a serif title and a single sentence of subtitle in the sans-serif. Content slides should carry one chart each, with the finding stated as the slide title and the source line kept under the figure. Data slides are the style's natural home: label lines at their ends, keep a single accent hue for the series you want the audience to notice, and leave the rest in muted tones so the story is visible in a second.
For web interfaces, it works well for analytics dashboards, statistics portals and explorable data pages. Use a white background, blue-toned text, thin charts with direct labels, and a modest control strip for filters and the time slider. Pricing pages and marketing sections are less natural; if you need them, keep them text-led and reuse the same serif and sans pairing so the product and its explanations feel like one document.
For editorial and marketing work, treat each chart like a figure in a printed article. Give it a headline in the serif, a one-line subtitle describing the measure, the chart itself and then the source line. Long-form pieces can alternate prose with embedded charts in a single narrow column. The restraint helps newsletters and explainers feel trustworthy, which is the reason many readers trust the original.
A common mistake is to copy the palette and the serif while dropping the source line and the direct labels, which leaves a generic blue-and-white chart with none of the discipline. Another is to use too many series colours at once; the original keeps most lines muted and lets one or two stand out. If a figure cannot be sourced, do not dress it in this style, because the look promises something the content cannot honour.

Our World in Data — FAQ
What is the Our World in Data style?
It is a chart-first visual language created for presenting long-run statistics. It uses a white canvas, Oxford-blue text, thin coloured lines labelled at their ends, a pale-to-navy map scale, a serif for titles and a humanist sans-serif for data, and it prints the source and years under every figure.
Where did it come from?
The project was founded in 2014 at the Oxford Martin School at the University of Oxford by Max Roser. In 2019 it became part of the Global Change Data Lab, and the current Grapher look took shape in the early 2020s.
Which fonts does the style use?
Playfair Display, a high-contrast serif, sets titles and headlines. Lato, a humanist sans-serif, sets axes, numbers and captions. Using the two for different jobs is more important than the specific faces.
Is the style good for marketing pages?
Only for restrained ones. It excels at explanatory, evidence-led material such as reports and data stories. For loud promotional pages it feels too quiet, though the same typographic pairing can still lend a trustworthy tone.
What is the one thing not to drop when imitating it?
The source line under each chart, together with direct labels at the ends of lines. Without them the result is simply a blue-and-white chart, and the credibility that defines the style is gone.
Related design styles
 Cloud Brightening FleetBrightening becomes evidence. White ship-track lines score a cool-grey satell…
 Concorde SupersonicPhysics made prestige. Pearl grey, sky-blue window line, and one red wing vec…
 GitHub README Markdown (2014)Calm code authority. Blue links, gray code panels, and Inter/Mono stack on wh…
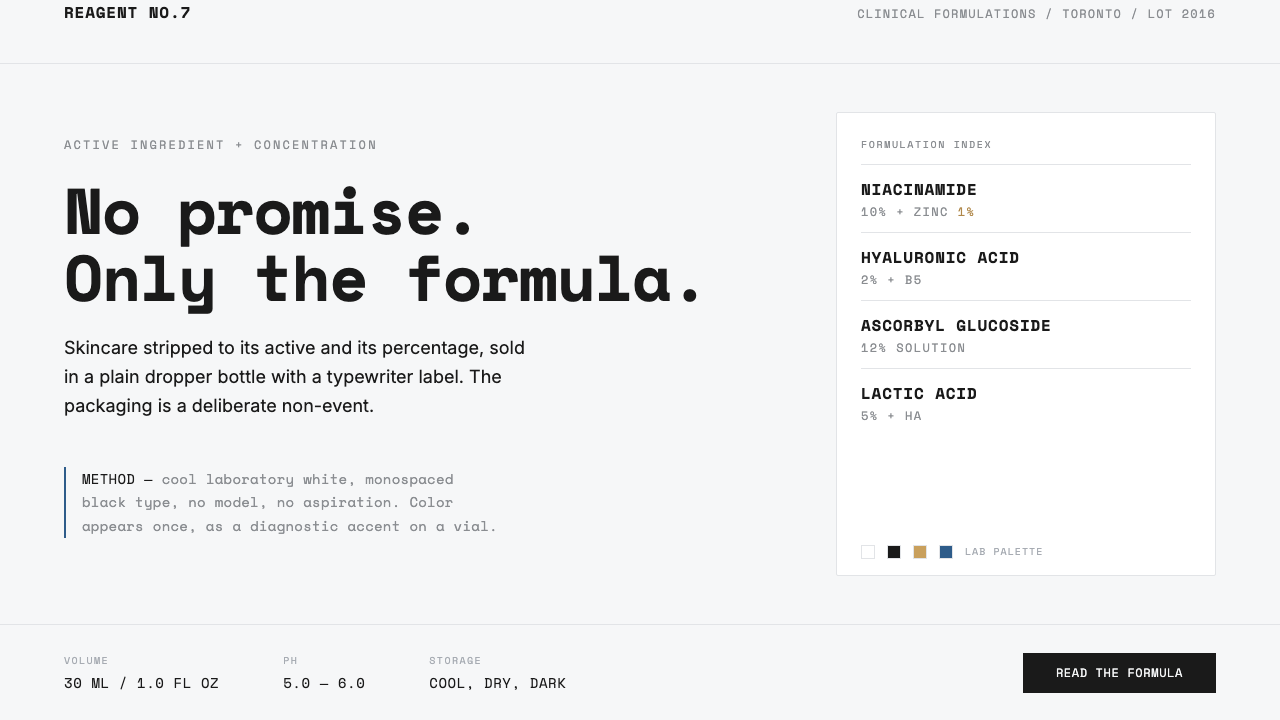 The OrdinaryNo promise, only the formula. Cool lab white, Space Mono labels, color as rar…
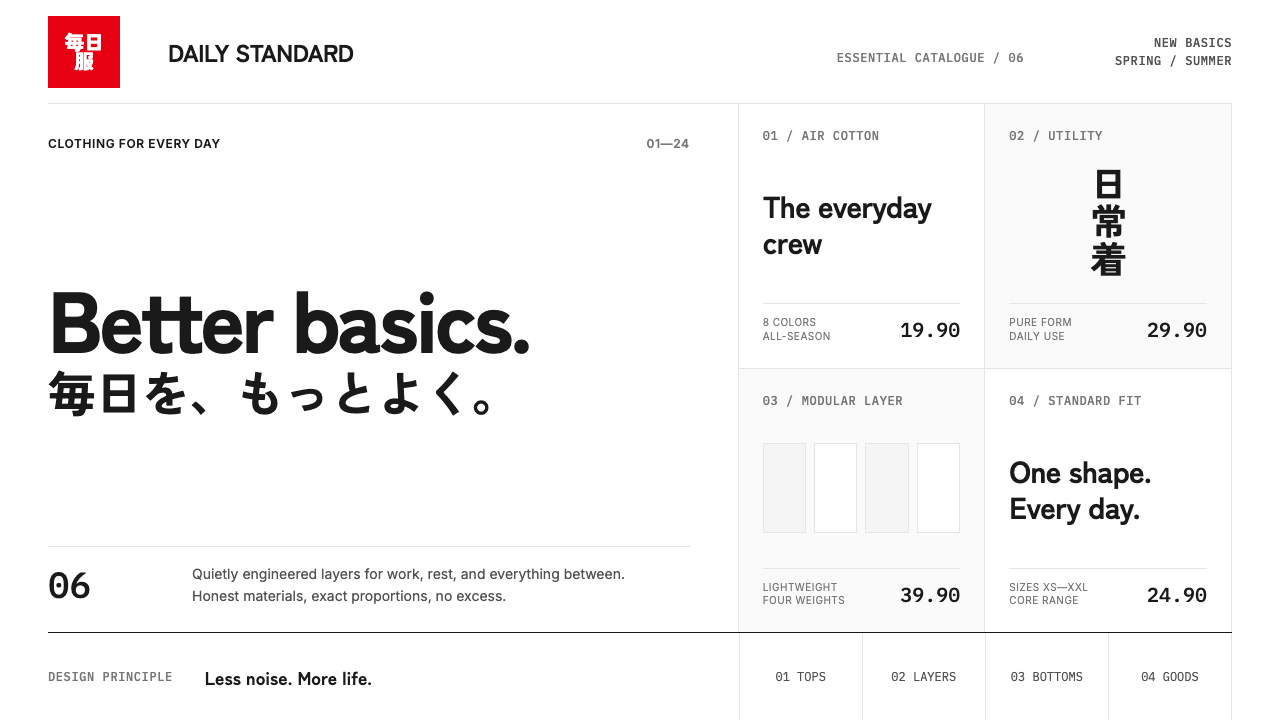 UNIQLO LifeWear (2006)Whitespace is the product. A hard modular grid and one rationed red square en…
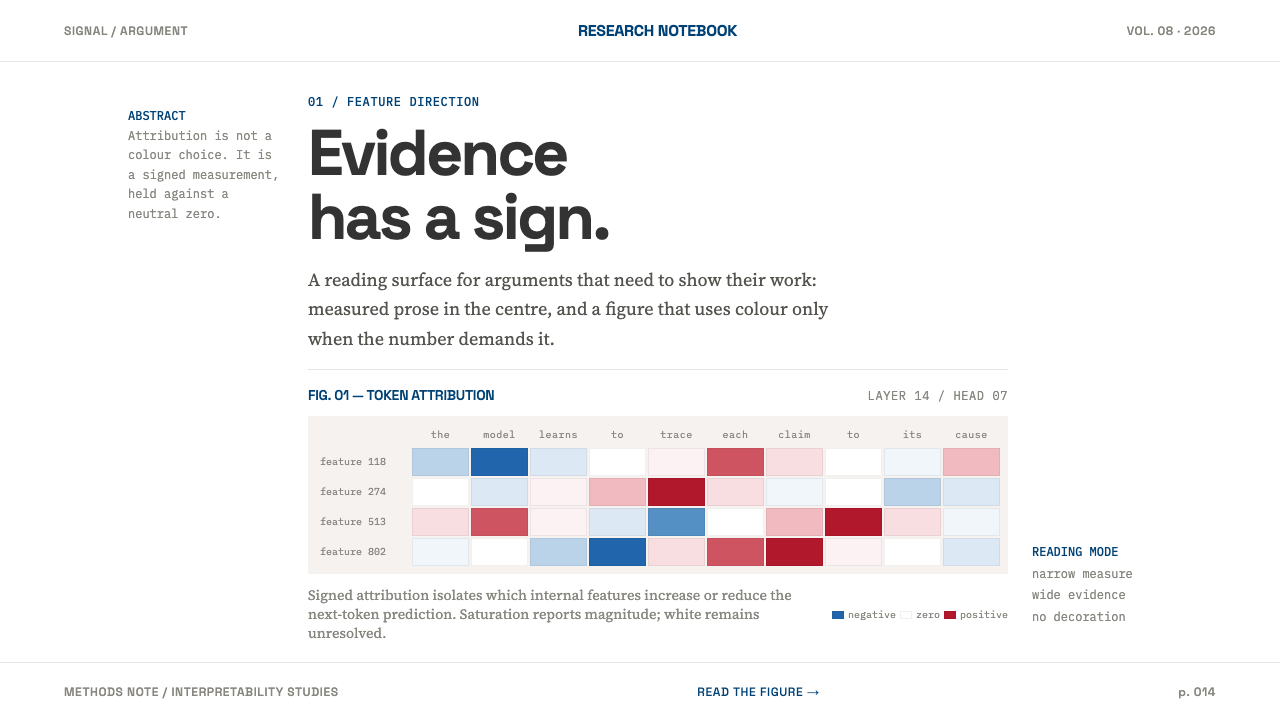 AI Alignment LabEvidence has a sign. Narrow serif prose yields to a red-blue attribution matr…