About Our World in Data
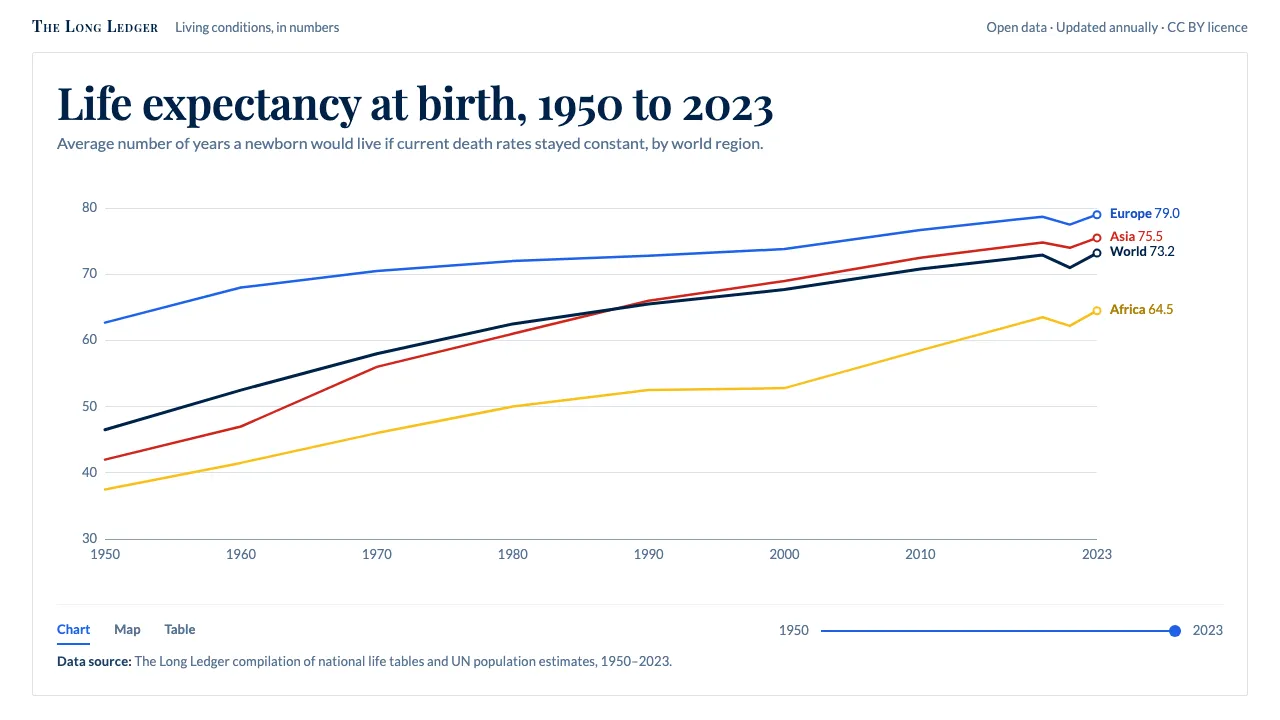
Our World in Data started at the University of Oxford in 2014 with a plain ambition: show how living conditions have changed across the world over centuries, and let anyone check the numbers. Every chart names its source, its unit and its years.
The look follows from that job. A white canvas, Oxford blue text, thin coloured lines labelled at their ends, a choropleth map running pale blue to deep navy, and a time slider along the bottom. Playfair Display sets the titles; Lato carries every number.
- Origin
- Oxford, United Kingdom
- Era
- 2014 founded at the Oxford Martin School; Global Change Data Lab 2019; current Grapher visual ~2020–2024
- Key figures
- Max Roser · Hannah Ritchie · Esteban Ortiz-Ospina · Edouard Mathieu
- Movements
- open-data journalism · long-run quantitative history · Tufte-style chart minimalism
Our World in Data design spec
Colors
Background
Surface
Primary
Secondary
Accent
Text
Typography
Playfair DisplayHeadings
LatoBody
ui-monospaceMono
Unlock for 1 credit
The other 11 sections — buttons, cards, spacing, motion, techniques and more — open once you unlock. Download the DESIGN.md or send it to your AI in one click. Unlock once, yours forever.
Sign up nowHave an account? Sign in
Styles similar to Our World in Data
Also inspired by science & nature, with a close feel.
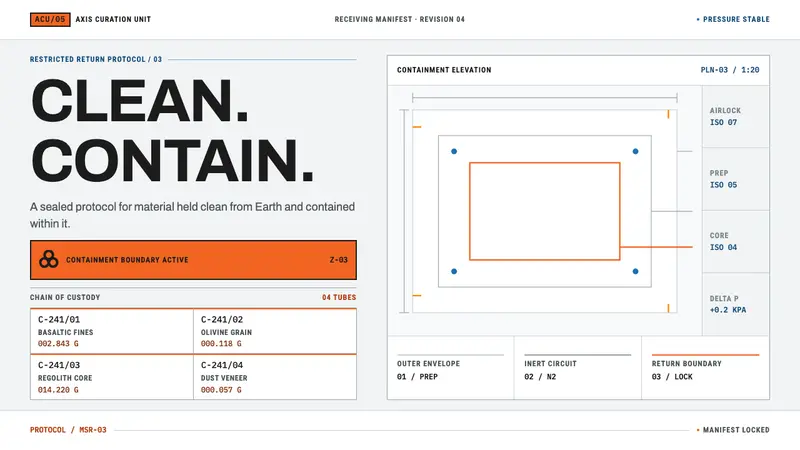 Mars Sample Curation LabPrecision holds the contradiction. Cleanroom grids meet blaze-orange containment plates.
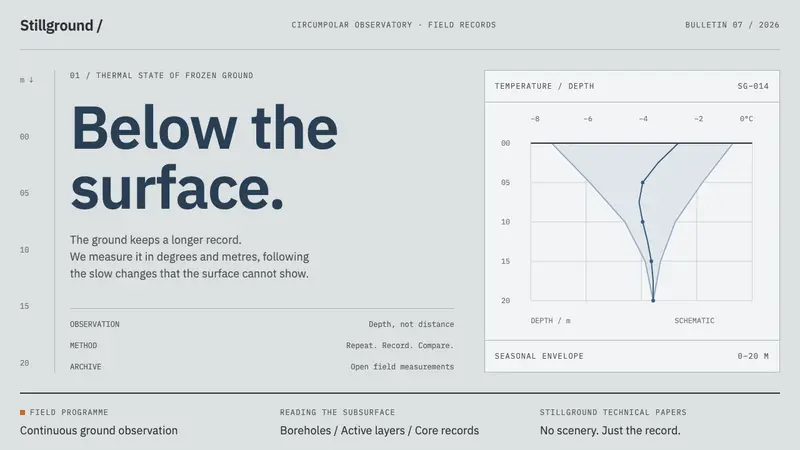 Permafrost Monitoring NetworkDepth sets the order. Overcast greys, slate profiles and hairline rules keep the record precise.
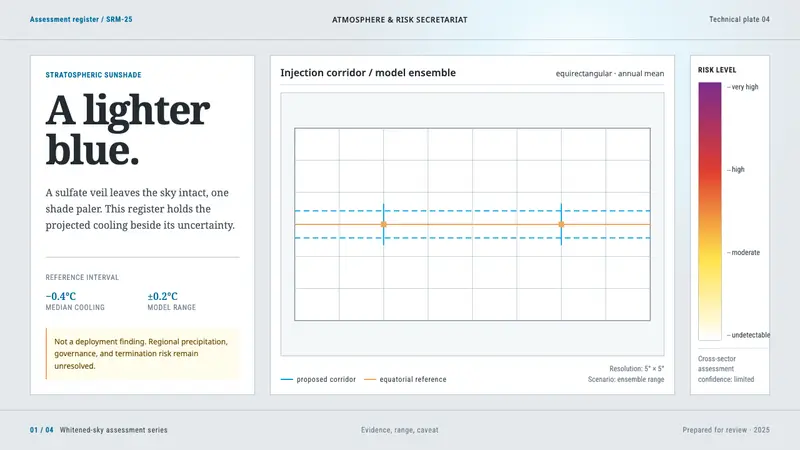 Stratospheric SunshadeUncertainty is the message. Pale sky stock, UN blue corridors, and an IPCC risk ramp hold the record.
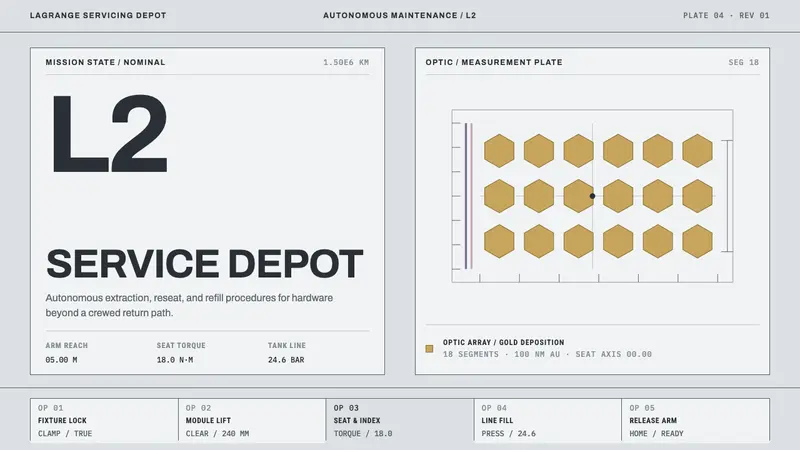 Lagrange Servicing DepotEngineering without theatre. Cleanroom grey, strict rules, and gold reserved for the optic.