What is JMA Shindo Map?
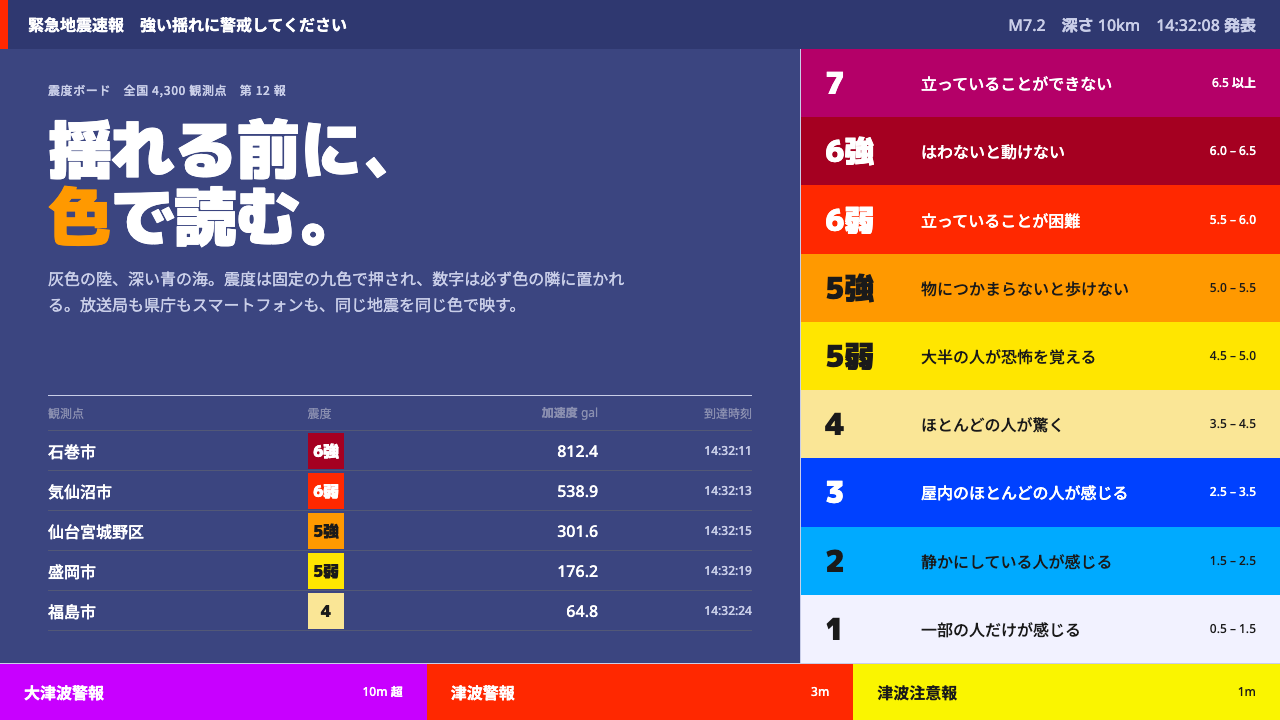
The JMA shindo map turns public-safety information into a strict colour code: grey land, deep-blue sea, and a ladder of intensity patches in which every hue does exactly one job.
JMA Shindo Map in brief
The JMA shindo map is the image of Japan that appears on screens within moments of an earthquake: the seismic intensity distribution map issued by the Japan Meteorological Agency, with a grey landmass sitting on a deep-blue sea and patches of colour laid over it to show how strongly each place shook. Shindo is a scale of local shaking, not of the quake's raw size, and the map's colours climb the scale from shindo 1 up to shindo 7. Unlike most styles in a design library, this one was not invented by a designer chasing a look. It is a working instrument of government warning cartography, and its appearance is a by-product of its job.
The governing idea is that every colour does one thing. Land is grey so that it recedes. Sea is deep blue so that the coastline reads instantly and the land holds its shape against it. Intensity is the only thing permitted to be loud, and it appears as a fixed ladder of swatches in which each step owns a single assigned colour, with the numeral always written beside the swatch. Label text laid over a swatch flips between white and near-black according to a table, not according to taste. There are no gradients, no shadows and no rounded corners. Panels are plain rectangles pinned to the edge of the screen, in the way a caption bar sits over a television picture.
The result is a dark, sober, official look that is nonetheless one of the most widely read pieces of graphic design in the country. Millions of people look at it in the seconds before the shaking arrives, often from across a room, so the system is built for legibility at a glance and for exact consistency: the same event has to look identical on a national broadcaster, a prefectural office and a phone app. Its authority is not a styling decision. It is the visible consequence of every colour having one fixed meaning.

Where does JMA Shindo Map come from?
This style does not descend from an art movement, a studio or a school. Its lineage is public-safety information design, and its closest relatives are other forms of government warning cartography: weather maps, hazard maps and the colour-coded advisories that agencies publish when people need to decide quickly what to do. The designers, in the sense of the people who made decisions about hue and contrast, are best understood as an institution applying rules, and the rules matter more than any individual hand.
The rules are written down. The Japan Meteorological Agency (気象庁) publishes a guideline on how colours must be set for the meteorological information on its website, and that document dictates the colours themselves as exact RGB values, entry by entry. Land has to be grey. Sea has to be blue. Each level of shindo has its own fixed value. The reason is practical rather than aesthetic: if a public broadcaster, a regional government and a commercial app each chose their own palette, the same earthquake would look different depending on where you read about it, and in an emergency that inconsistency costs time.
The scale itself has a history that shows in the interface. In 1996 the upper part of the shindo scale was split so that levels 5 and 6 each gained a weaker and a stronger half, written 5弱 and 5強, 6弱 and 6強. That is why the map's ladder, running from 1 to 7, has nine steps rather than seven, and why those middle steps have to stay distinguishable even though they sit side by side. The colour table has been revised since: the version this style follows reflects a revision made in July 2020. The system is therefore maintained rather than frozen, but changes arrive through the guideline, in public, and not through anyone's redesign.
Broadcasting carried the look into everyday life. The agency's graphics are echoed by NHK and by commercial broadcasters, which follow a broadcast-unified standard for warning graphics, and they appear as a caption frame laid along the edge of the television picture during earthquake early warning (緊急地震速報) alerts, frequently before the shaking has actually reached the viewer. Tsunami warnings reuse the same base map and simply add a heavily saturated band along the coastline. The footprint is the whole of Japan, from the agency's own site to nationwide television and the phones in people's pockets.
What defines the JMA Shindo Map look?
Colour by role
Every colour is assigned a job and keeps it. Land is a neutral grey that recedes behind everything, the sea is a deep blue that frames the coastline, and only the intensity ladder is allowed to be vivid. Because the background pair is deliberately dull, even a small patch of intensity colour on a small island is still the loudest thing in the picture, which is exactly what a warning needs.
The intensity ladder
Intensity is shown as a ladder of nine discrete steps, from shindo 1 to shindo 7, with the weaker and stronger halves of 5 and 6 in between. Each step has its own colour, the progression escalates in visual weight as the shaking does, and neighbouring steps are chosen so that they never blur into one another. It is a discrete scale and it is drawn as one, with no smooth ramps and no interpolation between steps.
Numeral beside swatch
The number is never left to colour alone. A swatch is always accompanied by its numeral in the same row, so that the reading survives a poor screen, a distant glance or colour-blind viewing. Colour makes the reading fast; the number makes it certain. This redundancy is one of the most transferable habits in the whole system.
Label contrast by table
Text laid on a swatch is either white or near-black, and which one applies is decided step by step by a table instead of by a designer's eye. The rule keeps labels readable on every step, and it means that two independent implementations will agree about it without ever consulting each other. Judgement is replaced by lookup, on purpose.
Flat, pinned panels
Panels are hard-edged rectangles, fixed to the edge of the screen like a broadcast caption. There is no elevation, no rounded corner, no blur and no gradient. Without shadows to imply layers, hierarchy comes entirely from placement, size and the single permitted loud colour, which keeps the picture honest about how little it is saying.
One base map, many warnings
The grey-and-blue base map is a platform, not an illustration. Tsunami warnings use the very same base and add a saturated band hugging the coastline, so a viewer who has learned to read one product can read the other without learning anything new. Reuse is part of the safety design, because every unfamiliar convention is a place where a reader can hesitate.
Dark, low-key ground
The overall tonality is dark and subdued. With grey land and deep-blue sea occupying most of the picture, the intensity colours are the brightest things on the screen, and a layout can be read across a room in a few seconds. The register is that of an official notice: no personality, no flourish, nothing that has to be decoded.

Who shaped JMA Shindo Map?
The issuing authority and the owner of the whole system. The agency defines the shindo scale, publishes the seismic intensity distribution map and the guideline that fixes its colours, and runs the early warning service whose alerts the television graphics carry. The style is, in effect, a portrait of that institution's priorities: accuracy, uniformity and speed over self-expression.
Japan's national public broadcaster, named in the source brief for its broadcast-unified standard for warning graphics. Its role is to carry the agency's colour logic onto television, where the map appears as a caption frame over the programme picture. Commercial broadcasters follow closely matching practice, so the same visual vocabulary reaches viewers whichever channel they happen to be watching.
The document that makes the style a standard instead of a taste. It sets colours as exact values and fixes their roles: grey for land, blue for sea, a defined value for each level of shindo. It is the reason a broadcaster, a prefectural office and a phone app can all draw the same earthquake in the same way, and the reason the colour table can be revised in the open, as it was in July 2020.
The broadcast format in which many people meet this visual language: a caption frame placed along the edge of the television picture, carrying the map and the intensity colours, often before the shaking has arrived. The format explains the style's insistence on speed of reading, fixed placement and a complete lack of decoration.
How do you use JMA Shindo Map today?
The shindo map style is a good choice whenever a design has to convey ordered severity quickly and without argument, and a poor one when a design wants to charm. Applying it well means borrowing the discipline of the original, which is that each colour is given one job and keeps it, and not merely copying the look of a grey map with coloured patches on it.
For presentation slides, the cover is best built from very little: a deep-blue field, one neutral grey shape standing in for land, or for any subject you want to set against a background, and a single intensity-coloured patch with a large numeral beside it. Content slides should be treated as panels pinned to an edge, with a short title, a numeral next to a swatch and no decorative dividers. Data slides are where the style is most at home. An ordered legend of discrete steps, each with its own swatch and its own number, works for risk levels, severity tiers, service-level bands or survey scales, and the chart should show those steps as blocks rather than as a smooth gradient.
For web interfaces, the natural territory is the operational dashboard: status pages, incident consoles, monitoring boards, alert triage lists and map-based tools. Keep the base surface dark and neutral, give every severity level one fixed colour with its number or name written beside it, and use that same colour for that same level on every screen. Pricing pages and other persuasion-led screens are a weaker match, because the style has no warmth to offer. If you must use it there, restrict it to a comparison table of tiers and let the numerals do the work.
For editorial and marketing work, the style suits explainers, data journalism, preparedness guides, safety and insurance communication, and anything that wants to sound like an institution. A feature layout can place a grey-and-blue base graphic at the centre, with a single column of labelled swatches along one edge. Keep headlines plain and let the data carry the authority. Marketing copy that tries to borrow the seriousness of a warning for a product launch will feel off, so use the style where seriousness is true.
The most common mistake is to treat the intensity colours as decoration. Spread them across a layout to add energy and the system loses the one thing that gives it meaning, because a viewer can no longer tell which colour is signalling and which is ornament. The other frequent errors are adding the gradients, shadows or rounded corners that the original refuses, showing colour without its numeral, and using alarm colours for ordinary content until they stop meaning alarm. And if you are building anything that communicates real hazard information to the public, work from the issuing authority's own current guidance: this style is a reference for the look, not a substitute for the official specification.

JMA Shindo Map — FAQ
What does shindo measure, and how is it different from magnitude?
Shindo is a scale of seismic intensity: how strongly the ground shook at one particular place. Magnitude, by contrast, describes the size of the earthquake at its source. A single earthquake has one magnitude but many shindo values, because places near the source usually shake harder than distant ones, and the map exists to show that pattern. That is why the image is a map of coloured patches and not a single number.
Why are the colours specified so rigidly?
Because consistency is the point. The agency's guideline fixes each colour as an exact value so that the same earthquake looks the same on the agency's site, on national and commercial television, on a prefectural office page and in a phone app. In a warning, a viewer who has to translate between palettes loses time. The rigidity is what allows millions of people to read the image without thinking about it.
Can this style be used for things other than earthquakes?
Yes, as long as the underlying idea carries over. Anything with ordered severity, such as incidents, risk levels, alert tiers or outage maps, can use a neutral base, a muted background pair and a ladder of fixed colours with numerals alongside. It works less well for products that rely on warmth, playfulness or persuasion, where an official, unadorned tone is a liability.
Why does the style avoid gradients, shadows and rounded corners?
Each of them adds a meaning that the data does not have. A gradient suggests a continuous scale where the real one has discrete steps. A shadow suggests layers and depth that carry no information. Rounded corners soften a message that is meant to be exact. Removing them keeps attention on the single thing that changes from place to place, which is intensity, and makes the image readable from across a room.
Is this the official Japan Meteorological Agency design?
No. It is a design language derived from the look of the agency's seismic intensity maps and the television graphics built on them, offered as a style reference. The agency's own guideline remains the authority on exact colours, and anyone building a product that presents real warning information should follow the official specification and sources directly.
Related design styles
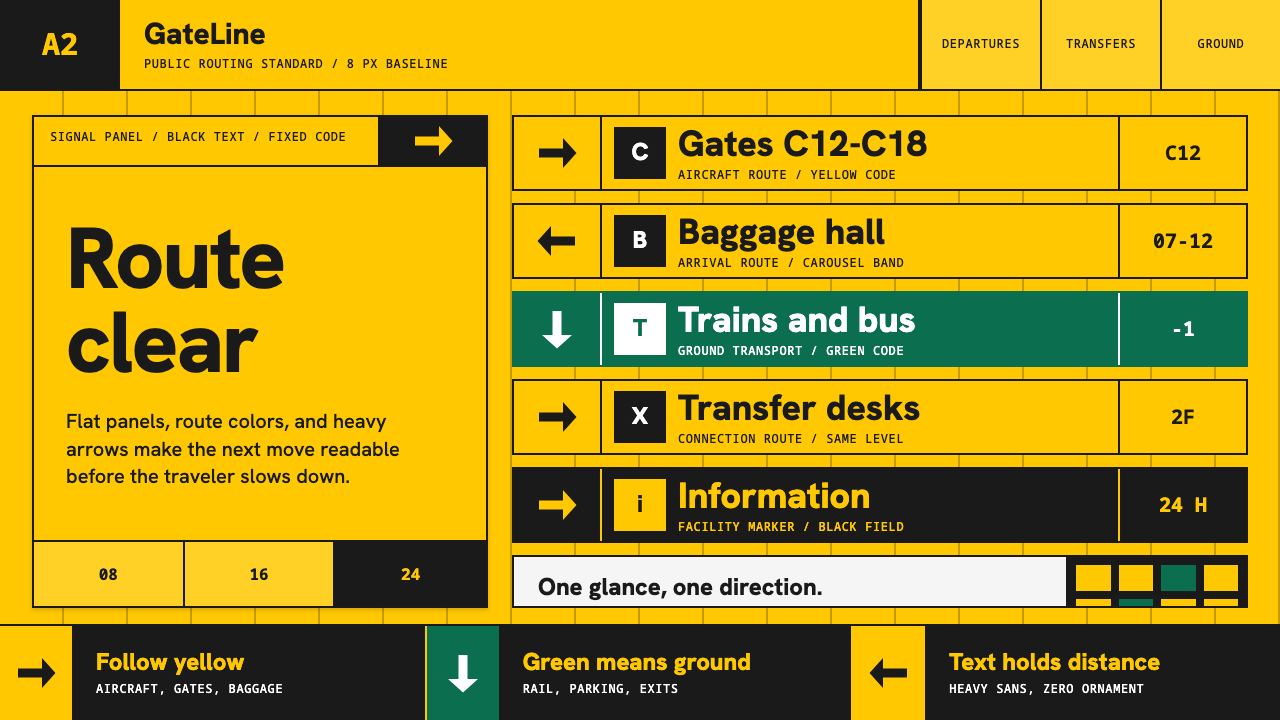 Airport Wayfinding GeometricLegibility becomes command. Signal yellow, black sans, and green route bands…
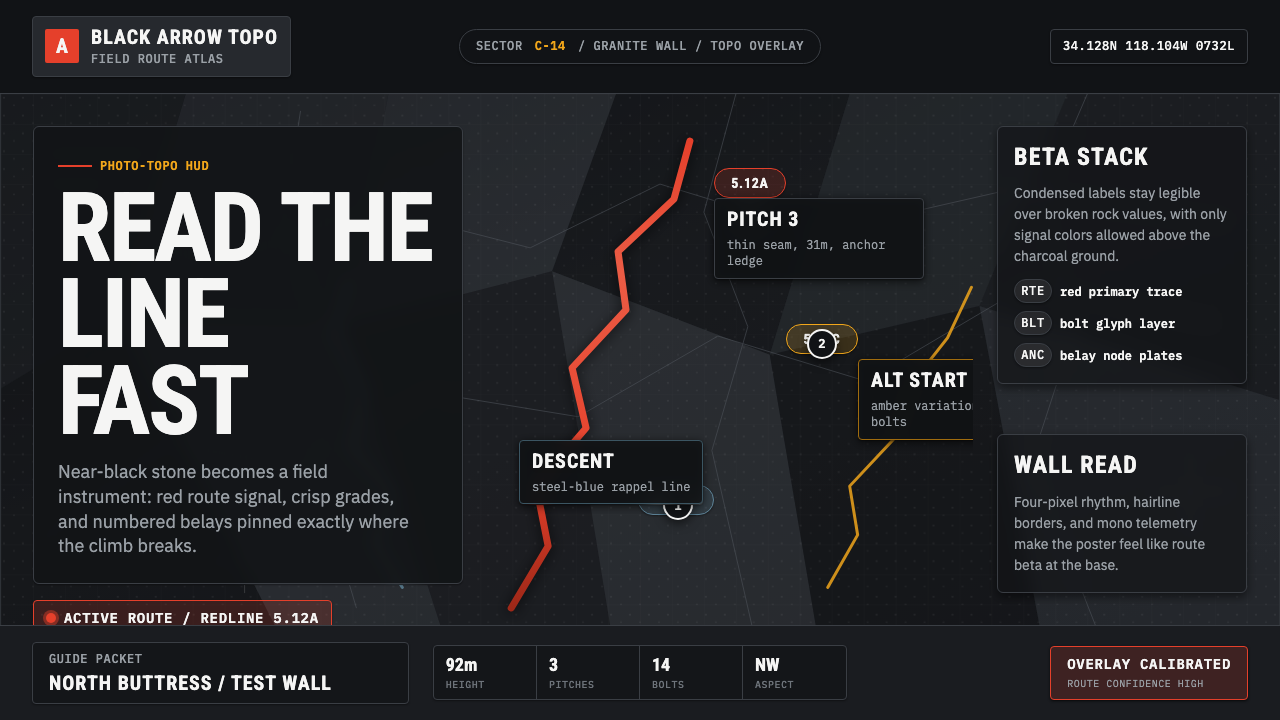 Climbing Topo GuideBeta at a glance. Red route telemetry cuts across near-black stone and conden…
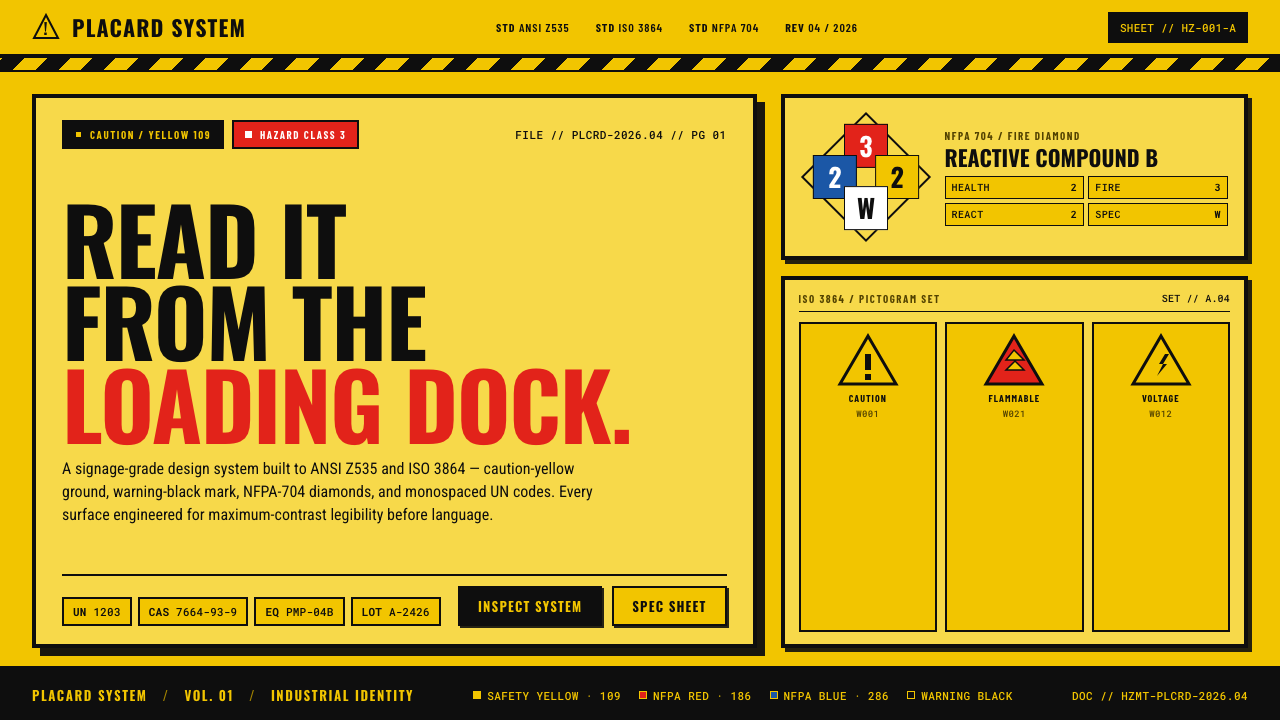 Hazmat SignageRead it from the loading dock. Caution-yellow ground, NFPA diamonds, monospac…
 All Blacks Silver FernOne colour, total force. Jet-black field, a single metallic-silver fern, whit…
 Container BIC CodeBuilt to be read, not admired. Gentian-blue ribs carry white stencil code and…
 Medellín Library ParkCivic gravity in slate. Near-black planes, cool grey hairlines, and bold wayf…