What is Glacier Blanket Project?
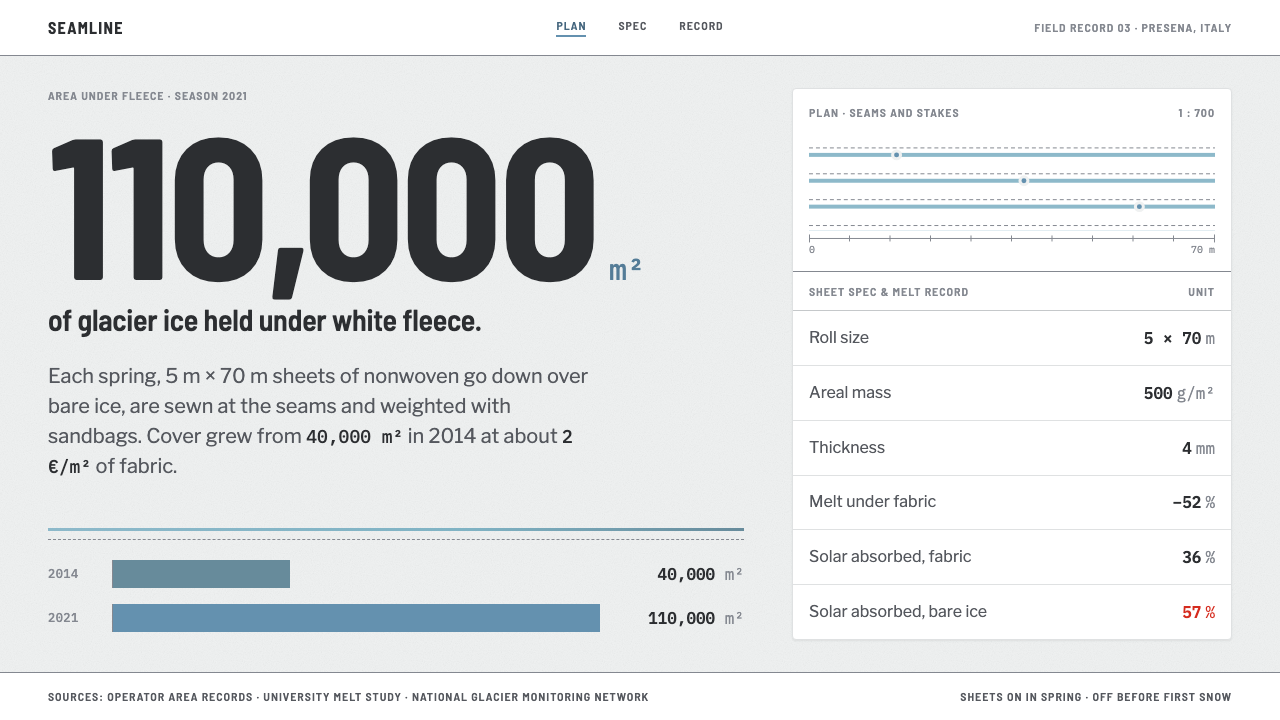
The Glacier Blanket style takes its look from white geotextile laid across alpine ice: a matte, felted off-white page, glacier blue only where the fabric parts, monospaced units on every figure, and red spent exactly once.
Glacier Blanket Project in brief
The Glacier Blanket style is a design system modelled on a survey report rather than a postcard. It is derived from a specific job: each spring, crews unroll white nonwoven geotextile across bare glacier ice in the Alps, sew the sheets together, weigh them down with sandbags and stones, and in autumn strip it all off again. The page takes the fabric as its ground: matte, felted and a faintly grey-green white. Glacier blue appears only where the sheets part and ice shows through, measurements are set in monospaced type, tables are wide and ruled, and a Swiss red is spent exactly once, on the figure that should alarm you.
The material is large and specific. Each sheet is 5 metres by 70 metres, with a weight of 500 grams per square metre and a thickness of 4 millimetres. The covered area on the Presena glacier grew from 40,000 square metres in 2014 to more than 110,000 square metres by 2021, and measurements by the University of Milan found 52 per cent less melt beneath the cloth. These are figures to be reported plainly, and the style has the reporting voice to match: units on every row, tables rather than charts, no atmosphere.
That voice is the style's distinguishing feature. Climate imagery usually leans on drama: sweeping landscape photographs, cinematic blues, alarm reds. This system refuses all of it. It looks like the document you would write to measure the problem, and it trusts the numbers to carry the emotion. The tone is sober, procedural and slightly industrial, the way engineering reports on infrastructure sound. It is a useful reference for any project that has to report difficult news without performing grief: the interface informs, then gets out of the way.

Where does Glacier Blanket Project come from?
The practice behind the aesthetic is local-scale geoengineering. Ski resorts and glacier operators in the Alps began covering parts of glaciers with reflective fleece to slow summer melt. The era in the record runs from the mid-2000s to the present, with Rhône Glacier fleece in use from the 2000s. The places named are Presena and Stelvio in Italy, and the Rhône and Titlis glaciers in Switzerland.
Presena is the best-documented example. The area covered there grew from 40,000 square metres in 2014 to over 110,000 by 2021, which means the covered field nearly tripled in seven years. The work is repetitive and physical: unroll in spring, sew the seams, anchor with sandbags and stones, strip in autumn. The design system keeps that cyclical, seasonal rhythm in its language, treating the fabric as something laid down and taken up again rather than as a monument.
Scientific monitoring is the other half of the story. Glacier mass-balance monitoring, the measurement of how much ice a glacier gains and loses, supplies the kind of numbers the style is built to display. The key figures listed for the system reflect both sides of the work: Fritz Landolt AG, the company associated with the fleece; the glaciologist Matthias Huss; and GLAMOS, the Swiss glacier monitoring network. Together they point to a collaboration between practical covering and measured results, which is exactly the relationship a survey-style interface needs to display.
The movements the record ties the style to (local-scale geoengineering, glacier mass-balance monitoring and ski-resort adaptation engineering) are not design movements in the art-historical sense; they are fields of practice. That is unusual and useful. The system's visual choices are not imitations of another style; they come from what the work looks like when you stand on the ice: white cloth, blue gaps, numbers on a clipboard. Its integrity depends on keeping that origin visible rather than sliding into the generic green or eco look that environmental subjects usually attract.
What defines the Glacier Blanket Project look?
Fleece-White Ground
The page is the fabric: matte, felted, and white with a faint grey-green cast. It is deliberately not the bright white of a screen or the warm white of paper. The slight tint gives the surface a tactile, nonwoven quality and keeps large areas of the page from glaring, which matters in a data-heavy interface that people read for long stretches.
Blue Only at the Seams
Glacier blue is reserved for places where the white cloth parts and ice shows through. In interface terms it marks a gap, an edge or a point of exposure rather than serving as a general accent: a divider, a link, a boundary. Because it is rationed, blue stays meaningful. A page that used it everywhere would lose the metaphor of ice seen through a seam.
Monospaced Measurements
All dimensions, quantities and data points are set in monospaced type, and each number carries its unit. The monospace gives figures the look of instrument readouts and keeps columns aligned, so comparisons across rows are physical, a matter of lining up digits. Surrounding prose stays quiet so that measurement is always the loudest voice on the page.
Wide, Ruled Tables
Tables are the main structure rather than a supporting element. They are wide, with ruled rows, and every row carries its unit. The table is the native genre of the survey report, so the layout should treat it as the default way to present anything quantitative. Charts are secondary and tend to be flat and plainly labelled.
Red Spent Once
Swiss red appears one time on a page, attached to the figure that should alarm the reader. This is the style's most disciplined rule. Spending the alarm colour once means the eye goes to it immediately; spending it on every warning would turn it into wallpaper. The decision about which number deserves the red is an editorial decision, not a styling one.
A Survey, Not a Postcard
No dramatic landscape photographs fill the page, no cinematic washes of blue, no hero shots of the mountain. Imagery, when it appears, is documentary and subordinate to the data. This refusal of scenery is what gives the numbers credibility; they are presented the way an engineer or a monitoring programme would present them, without persuasion.
Seasonal Rhythm
The work follows a cycle: the cloth goes down in spring and comes up in autumn. The style reflects that in how it prefers to present information, as dated entries, season-by-season rows and comparisons between years such as 2014 and 2021, rather than as a single heroic snapshot. Time is shown in steps, in tables, with the same units repeated, so that change can be read as a difference between rows.

Who shaped Glacier Blanket Project?
A Swiss company named among the key figures in the covering work. It stands for the practical side of the system: sheets of fleece, seams, anchoring and removal in autumn. The style borrows that working vocabulary of rolls, seams and units rather than the more usual language of climate campaigns.
A glaciologist listed among the key figures, associated with the measurement side of the story: how much ice a glacier loses, and how that loss can be quantified. His inclusion reflects the style's commitment to numbers with units as the primary content.
The Swiss glacier monitoring network, listed among the key figures. Long-term monitoring programmes of this kind supply the measured series that the style exists to display. Their influence on the design is indirect but fundamental: tables, units and plain reporting are the habits of monitoring data.
How do you use Glacier Blanket Project today?
The Glacier Blanket style suits any content that is mostly measurement: environmental reporting, research dashboards, infrastructure and engineering documentation, sustainability reports, scientific data portals, monitoring tools, field reports. It is the right choice when credibility comes from showing the numbers plainly. It is the wrong choice for emotional storytelling or consumer marketing, where the style's deliberate sobriety would feel cold.
For presentation slides, the cover is a fleece-white field with a title and a short descriptor, perhaps one line in monospace giving a place and a date. Content slides lean on tables with ruled rows and units, one table per slide. Data slides should state the headline figure in monospace and spend the red on the single number that matters, such as a loss or a deficit. Glacier blue can mark a boundary or gap in a chart. Where a deck covers several seasons or years, a ruled table with one row per period reads better than a line chart.
For web interfaces, it suits dashboards, monitoring consoles, data portals and reports. Use the fleece-white as the base surface, build the layout from wide ruled tables, set every value in monospace with its unit, and use blue for dividers, links and the edges of exposed regions. Reserve red for a single critical alert per view. Pricing or plan pages, if you need them, become spec tables with units on every row.
For editorial and marketing work, think of annual environmental reports, field notes, white papers, project one-pagers and grant applications. Pair the documentary tone with images that are records rather than scenery: a seam, an anchor, a measuring stake. Captions should be factual. Let the headline be a number.
The most common mistake is to add the drama the style refuses: sweeping landscape photography, saturated blues, gradient skies, multiple reds for warnings. Using red more than once is the clearest failure, because it turns an editorial decision into decoration. Another is dropping the units, or setting numbers in the proportional text face, which breaks the instrument feel. Finally, avoid making the page bright white; the felted off-white is the surface the whole system rests on.

Glacier Blanket Project — FAQ
What is a glacier blanket?
It is a sheet of white nonwoven geotextile spread over glacier ice in spring to slow melting, and removed in autumn. The sheets described in the source material are 5 metres by 70 metres, sewn together and held down with sandbags and stones. On the Presena glacier, measurements by the University of Milan showed 52 per cent less melting under the cloth.
Why does the design use a grey-green white instead of pure white?
Because the page is modelled on the fabric, which is matte and felted rather than bright. The slight cast gives a tactile, low-glare surface suited to long reading of data, and it separates the system from the clinical white of generic dashboards.
Why is red used only once?
Red is the alarm colour, and its force depends on rarity. Spending it on one figure per view directs attention to the number that should worry the reader. If red appears on every warning, readers stop seeing it. Choosing which figure gets the red is an editorial judgment.
Can I use charts?
Yes, but tables are the default. Charts should be flat and plainly labelled, with units on the axes, in the same restrained palette: fleece-white ground, ruled lines, blue at the edges and monospaced labels. Avoid decorative three-dimensional effects, glossy fills and landscape backgrounds.
Is it only for environmental topics?
No. Its discipline (units on every figure, tables first, one alarm colour) suits any subject that is reported rather than sold: audits, lab results, logistics, infrastructure, finance in its sober registers. The glacier origin gives it a distinctive look, but the logic transfers.
Related design styles
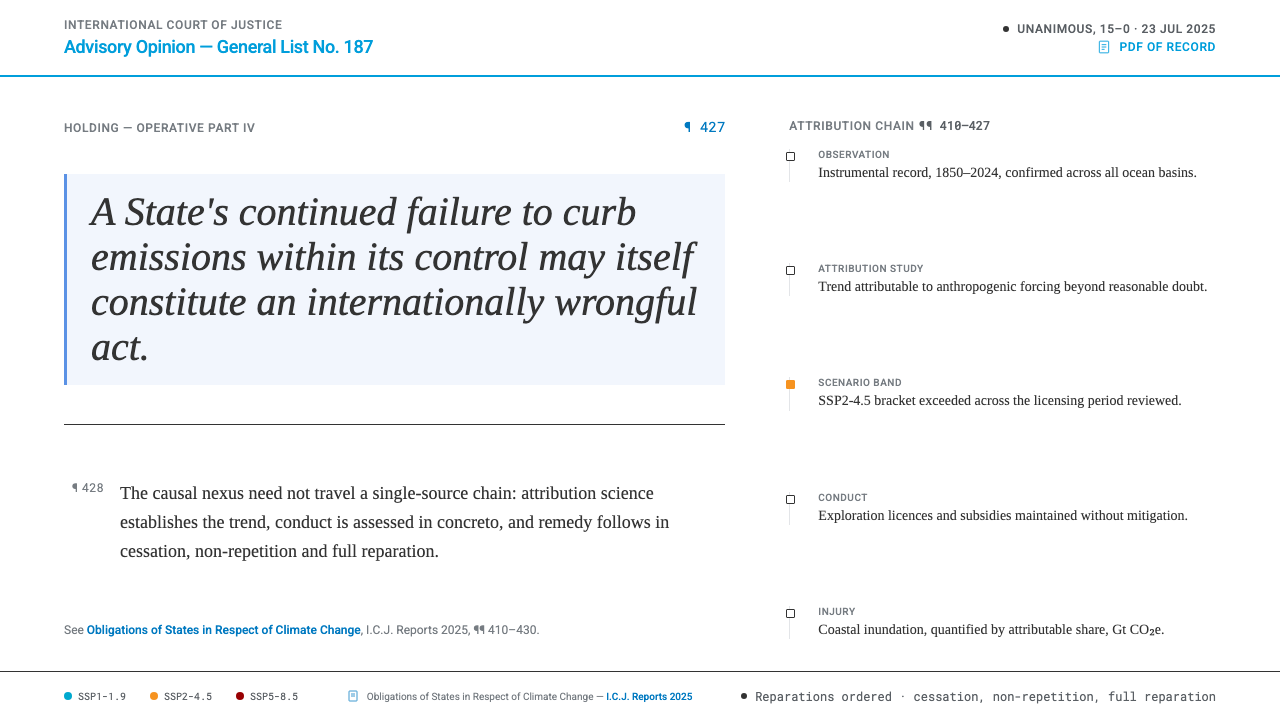 Climate Loss & Damage TribunalA ruling, not a rally. Graphite ink and UN Blue furniture carry IPCC scenario…
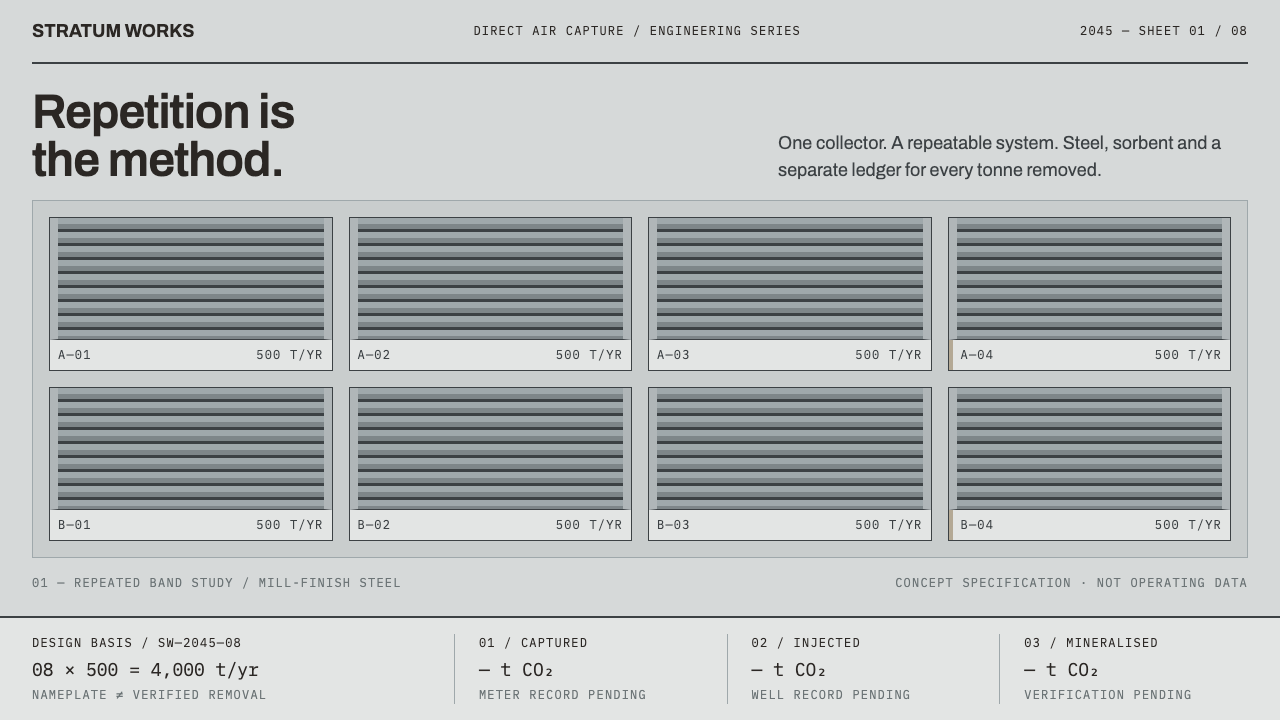 Direct Air Capture PlantRepetition, not rhetoric. Steel-grey louvre bands and monospaced ledgers make…
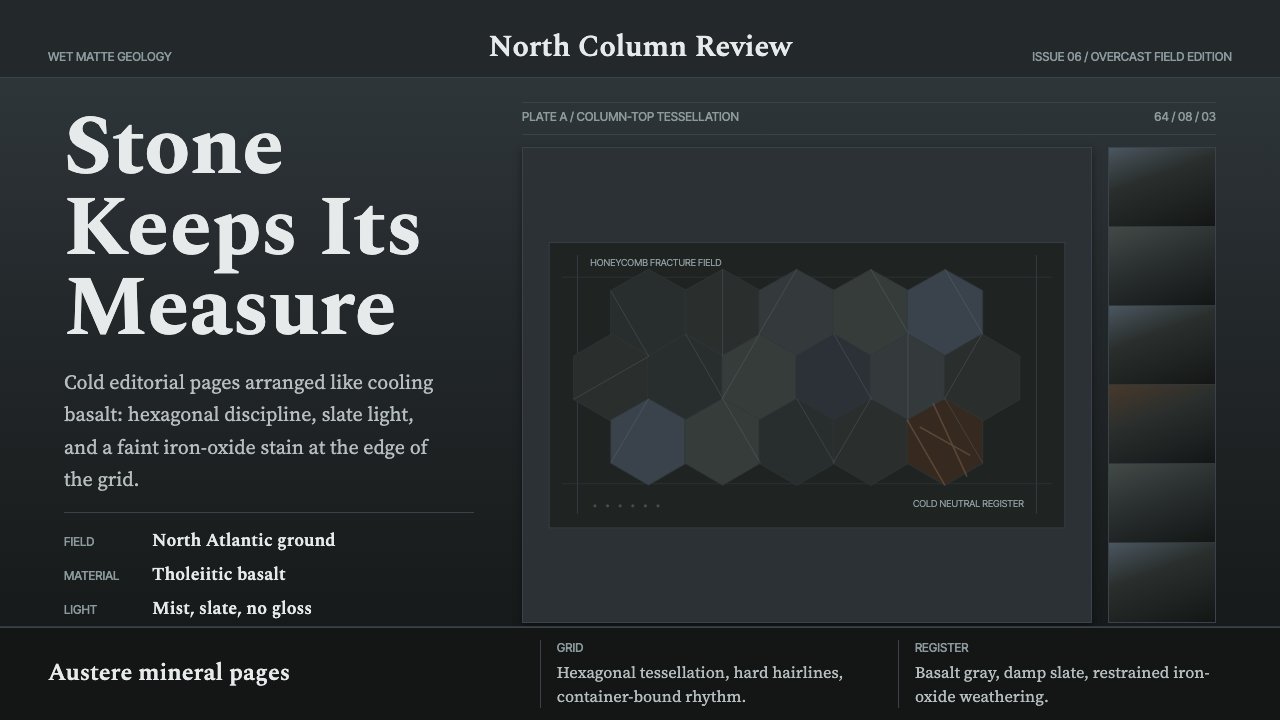 Giant's Causeway BasaltCold stone edits the page. Spectral type locks into slate hex grids and iron-…
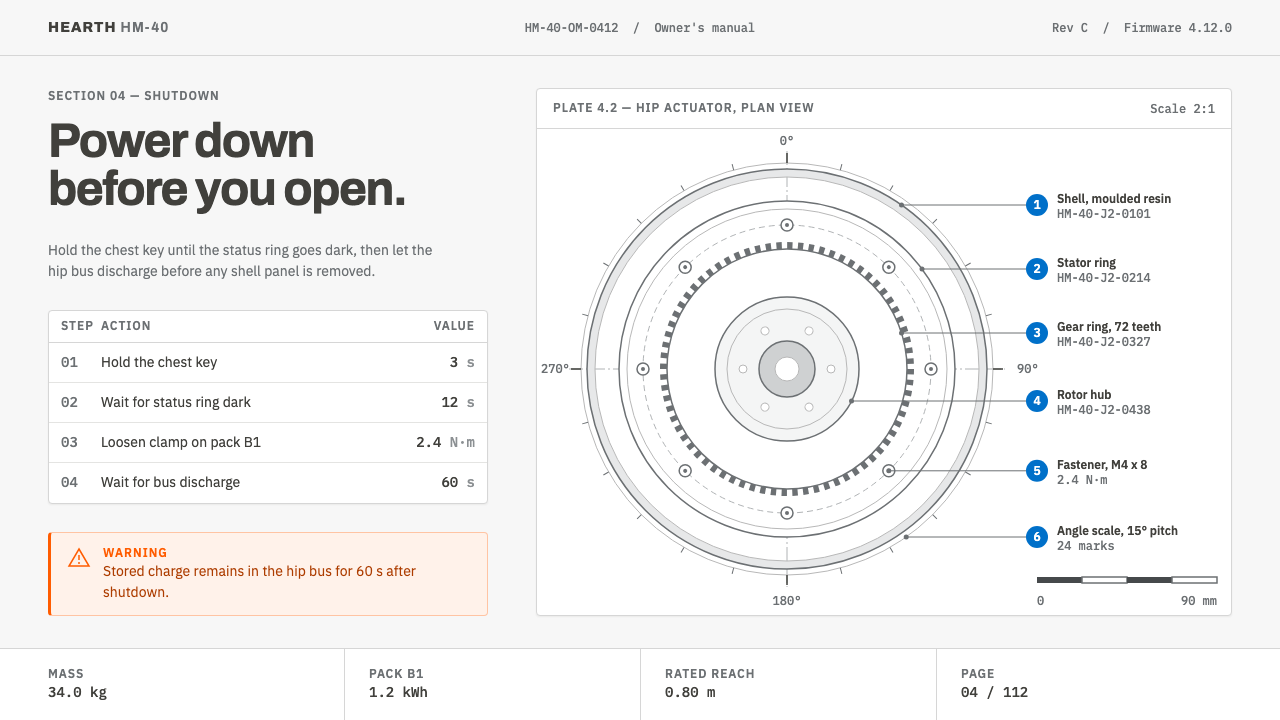 Home Robot ManualDocumentation, not a launch. Graphite line-art, blue callout numerals, one or…
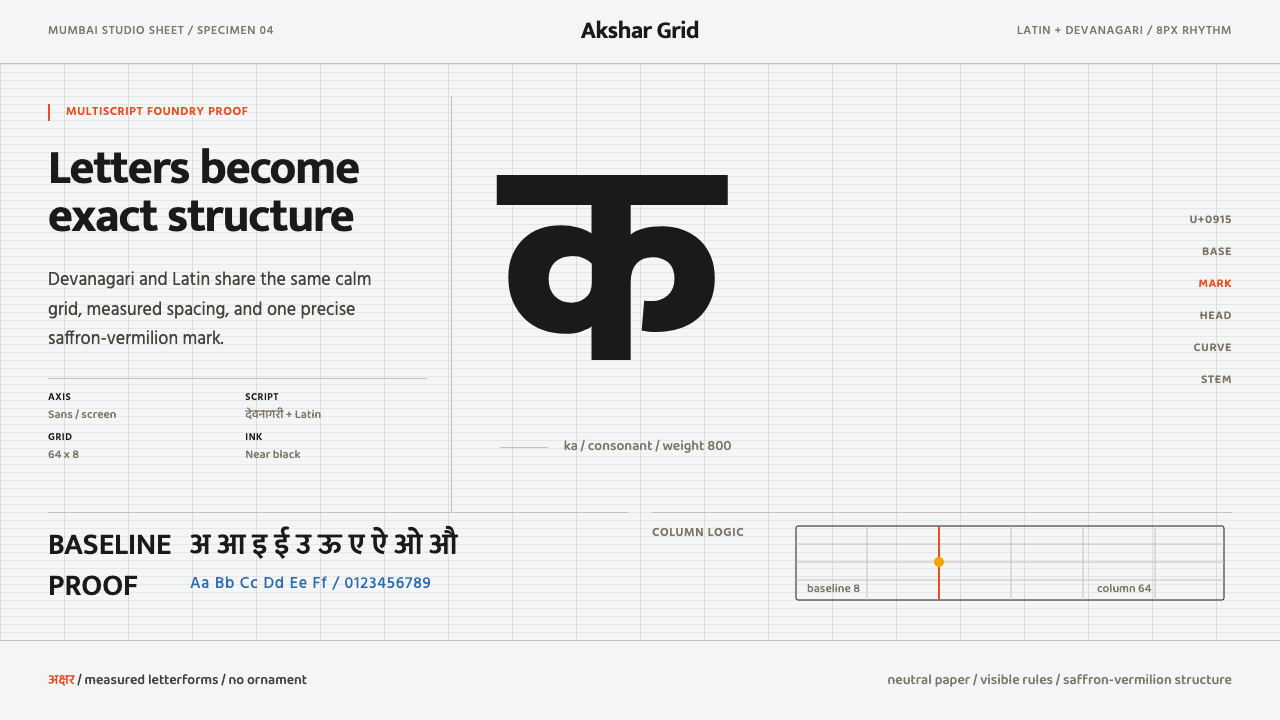 Modern Devanagari TypeType is the subject. Warm off-white grid, giant glyphs, one saffron-vermilion…
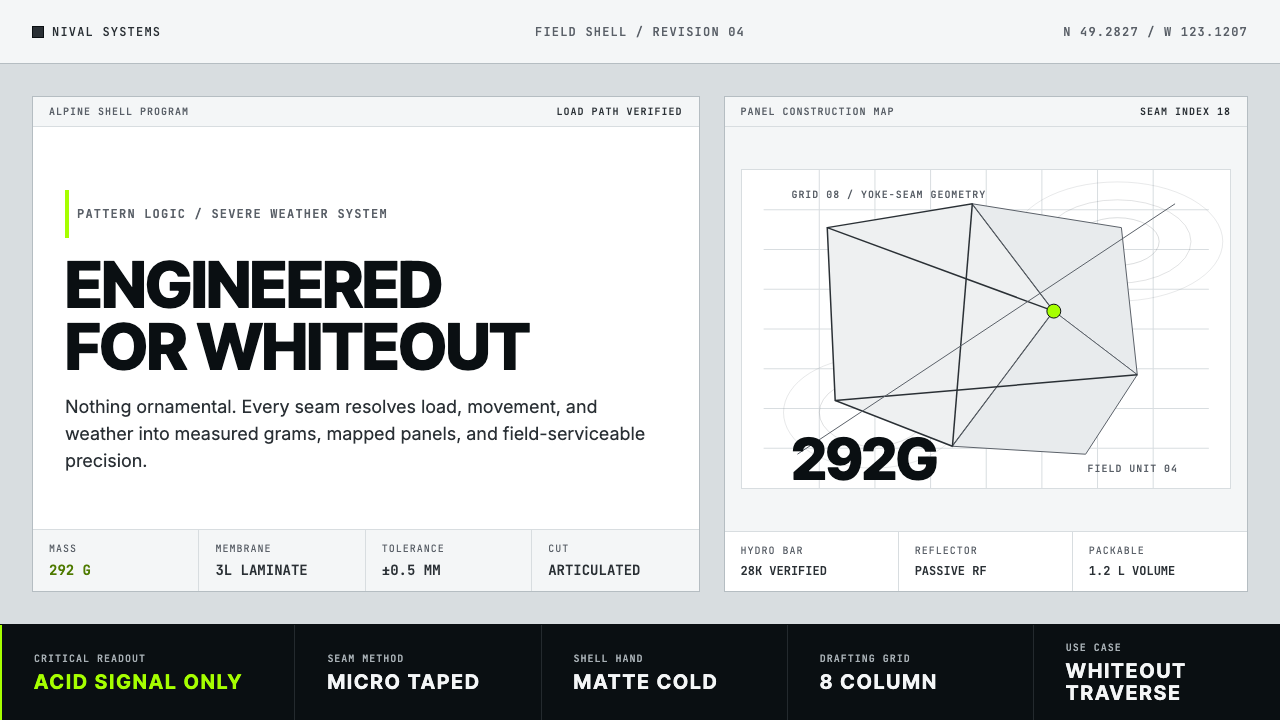 Arc'teryx Technical OutdoorEngineered, never ornamental. Glacier silver grid, mono specs, one acid-green…