What is Flightradar24?
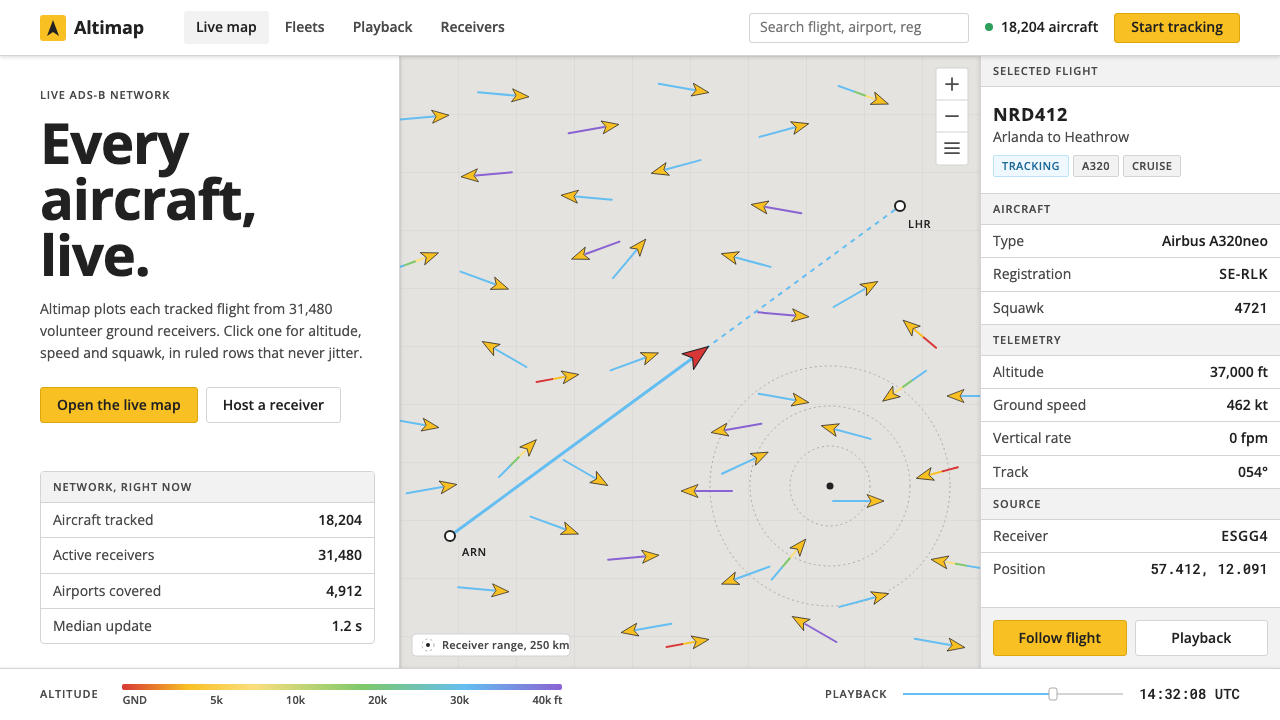
Flightradar24 hands the whole screen to the traffic: a quiet warm-grey map, yellow aircraft scattered across it, and dense white panels that open only when you ask.
Flightradar24 in brief
Flightradar24 is a live flight-tracking service, and its interface is one of the clearest examples of design built around a single flow of data. A quiet warm-grey roadmap fills the screen; small yellow aircraft glyphs are scattered across it, each trailing a path coloured by altitude; and clicking any aircraft slides open a dense white panel with its type, registration, altitude and speed set out row by row.
The idea is to let the traffic speak. The chrome is light, the typeface is plain Open Sans, and yellow is held back for exactly two things, the aircraft and the primary button, so that nothing else on the screen competes with the movement of planes. The map is the stage; the aircraft are the performance.
Visually it sits between a cartographic tool and an operations console. The base map keeps its roads and borders faint enough to act as reference rather than subject. The panels are compact and ruled like a table, built for people who want many facts at once. The style suits real-time monitoring, logistics tracking and any data-dense back office where the product's value is a live picture of things in motion.

Where does Flightradar24 come from?
Flightradar24 began in 2006 in Stockholm, when two Swedish aviation enthusiasts, Mikael Robertsson and Olov Lindberg, fed data from their ADS-B receivers into a web map. ADS-B is a system in which aircraft broadcast their own identity and position, and anyone with a suitable receiver can listen. What started as a hobbyist's experiment, putting the aeroplanes you can hear onto a map, turned out to be a product that many people wanted.
The service grew in the way its technology allows: through volunteers. Receivers hosted by enthusiasts around the world formed a network that reached tens of thousands of ground stations, so that today the map plots almost every tracked aircraft on Earth in real time. This is the tradition of the crowdsourced sensor network: instead of one organisation building global infrastructure, thousands of small contributions add up to coverage. Open aviation data, the idea that flight positions are broadcast and can be shared rather than locked away, is the principle that makes it possible.
The interface is also a product of its moment in web cartography. The live map was built on version three of the Google Maps JavaScript API, the 'slippy map' model in which a user drags and zooms a tiled map in the browser. That model fixed the visual grammar: a pale base layer so overlays stand out, markers that turn to show heading, and a side panel for details. Flightradar24 adopted the grammar and made it its own.
The current visual language dates from roughly 2015 to 2024. Over that period the design kept its discipline: the same warm-grey base, the same yellow aircraft, light white chrome and a plain sans-serif. The refusal to add decoration is deliberate. A flight tracker is used by people watching a delayed flight, by families waiting at arrivals and by hobbyists who stay with the map for hours, and in each case what they need is information that is quick to read and does not tire the eye.
What defines the Flightradar24 look?
Warm-Grey Roadmap Base
The base map is a pale, slightly warm grey, a roadmap rendered with roads, borders and place names quiet enough to disappear into the background. The warmth keeps it from feeling clinical, and the low contrast means that anything laid on top, above all the aircraft, stands out immediately. The map is treated as a reference surface, not as scenery.
Yellow Aircraft Glyphs
Each aircraft is a small yellow glyph, drawn as a simple plane silhouette that turns to show its heading. Yellow is the brand colour and it is rationed: it belongs to the aircraft and to the primary button and nowhere else. On a grey map that single hue makes thousands of moving objects legible at once, and because the same yellow marks the main action, the brand and the data are visually tied together.
Altitude-Coloured Trails
Behind a selected aircraft runs a trail whose colour changes with altitude, so a viewer can read a climb or a descent along the path without opening a chart. It is the one place where the interface lets colour carry data, and it does so as a gradient along a line, not as a decoration. The trail turns a point on a map into a story with a before and an after.
Dense White Panels
Clicking an aircraft opens a white panel on the side of the screen, filled with rows of facts: aircraft type, registration, altitude, speed, route. The rows are tightly set and divided by fine rules, in the manner of a spreadsheet or a timetable. The density is intentional; the panel is where an interested viewer goes for detail, and it is designed to deliver as much as possible per glance without scrolling.
Plain Open Sans
All type is set in Open Sans, a humanist sans-serif chosen for its legibility at small sizes and its absence of personality. There is no display face and no decorative lettering. Hierarchy comes from size, weight and position, and the page lets the aircraft registrations, flight numbers and altitudes read as plain facts. The type behaves like signage in an airport: you notice the information, not the font.
Light Chrome, No Competition
The surrounding interface, including toolbars, search and filters, is light, flat and compact. Controls are kept small and given only the contrast they need. The aim is a clear hierarchy of attention: first the aircraft, then the panel for the selected aircraft, then everything else. Any element that does not serve that order has been removed.

Who shaped Flightradar24?
One of the two Swedish aviation enthusiasts in Stockholm behind Flightradar24's beginnings in 2006. His name is tied to the early idea of feeding ADS-B receiver data into a web map, an idea that turned a hobby into a global service. His story is a reminder that the style's functional, no-nonsense look comes from people who started out as users of exactly this kind of information.
The other of the two founding enthusiasts. Together with Mikael Robertsson he belongs to the origin of a service built on volunteer-run receivers and open aviation data. The pairing illustrates the crowdsourced character of the project: it began with two people and a receiver, and it grew because many others added their own.
Tens of thousands of ground stations, hosted by enthusiasts around the world, supply the data that fills the map. They are the invisible co-authors of the interface: the sheer density of aircraft on the screen, and the need to make that density readable, is what forced the design to be as quiet and disciplined as it is.
How do you use Flightradar24 today?
The Flightradar24 style suits any product whose value is a live picture of things moving: fleets, shipments, deliveries, sensors, queues. It asks for one discipline above all: decide what the moving thing is, give it the only saturated colour on the screen, and make everything else step back.
For presentation slides, a cover can be a cropped map in warm grey with a scattering of yellow glyphs and a white title panel, a direct echo of the interface. Content slides work as ruled white panels with tightly set rows, which suit tables of figures, timelines and status lists. Data slides should keep one reference layer in grey and mark the subject in yellow, so the audience knows where to look before reading a number.
For web interfaces, the style fits operations dashboards, logistics trackers, monitoring consoles and admin tools. Use a map-first or table-first layout with a quiet base, a side panel that opens on selection, and yellow reserved for the main action and the live objects. Rows should be compact, aligned and separated by fine rules, so that scanning many items remains easy. Navigation and controls stay light, small and typographic.
For editorial and marketing work, such as data journalism, a live-event explainer or a product page for a tracking service, use the map as the hero, show a real panel with real rows rather than an abstract illustration, and let the yellow draw the eye once. Short captions in plain sans-serif type explain what is moving and why it matters. The honest, instrument-like look builds trust in the numbers.
The most common mistake is to treat yellow as a general accent and spread it over headings, badges, borders and icons. Once everything is yellow, nothing is. A second mistake is to mistake density for permission to skip hierarchy: dense panels still need clear alignment, consistent rows and an obvious order of importance. A third is to dress the base map in rich colour or heavy texture, which competes with the data it exists to support.

Flightradar24 — FAQ
Why is the map base grey rather than coloured?
Because the map is a reference layer and the aircraft are the subject. A pale, warm grey keeps roads, borders and place names visible but quiet, so that thousands of moving objects can sit on top without clutter. Colour on the base map would compete with the data and force the interface to use even stronger colours to stand out.
Why is yellow reserved for aircraft and one button?
It creates a single, learnable rule: yellow means something you can look at or act on. The aircraft are the live objects and the primary button is the main action, so the colour always points to the thing that matters. If yellow were also used for headings or decoration, that rule would break and the map would lose its focus.
Can the style work without a map?
Yes. The underlying approach is a quiet base, a single saturated colour for the live subject, and dense ruled panels for detail. That applies equally to a fleet table, a delivery timeline, a server status board or a trading-floor display. A map is just the most natural base layer for moving objects; any calm, low-contrast surface can play the same role.
How can such dense panels stay readable?
Through regularity. Rows share the same height and alignment, labels and values keep consistent positions, fine rules separate groups, and a plain humanist sans-serif keeps small text legible. The density is organised rather than crowded, so the eye learns where to find each fact and can move quickly through the panel.
Is there a dark version of this style?
The system is defined on a light ground: a warm-grey map and white panels. A dark version is possible, since monitoring tools are often used in dim rooms, but it is a separate design decision. The yellow would need to be re-checked for balance, the warm-grey base would have to be reinterpreted, and the panels would need new contrast rules. Treat it as an adaptation rather than a switch.
Related design styles
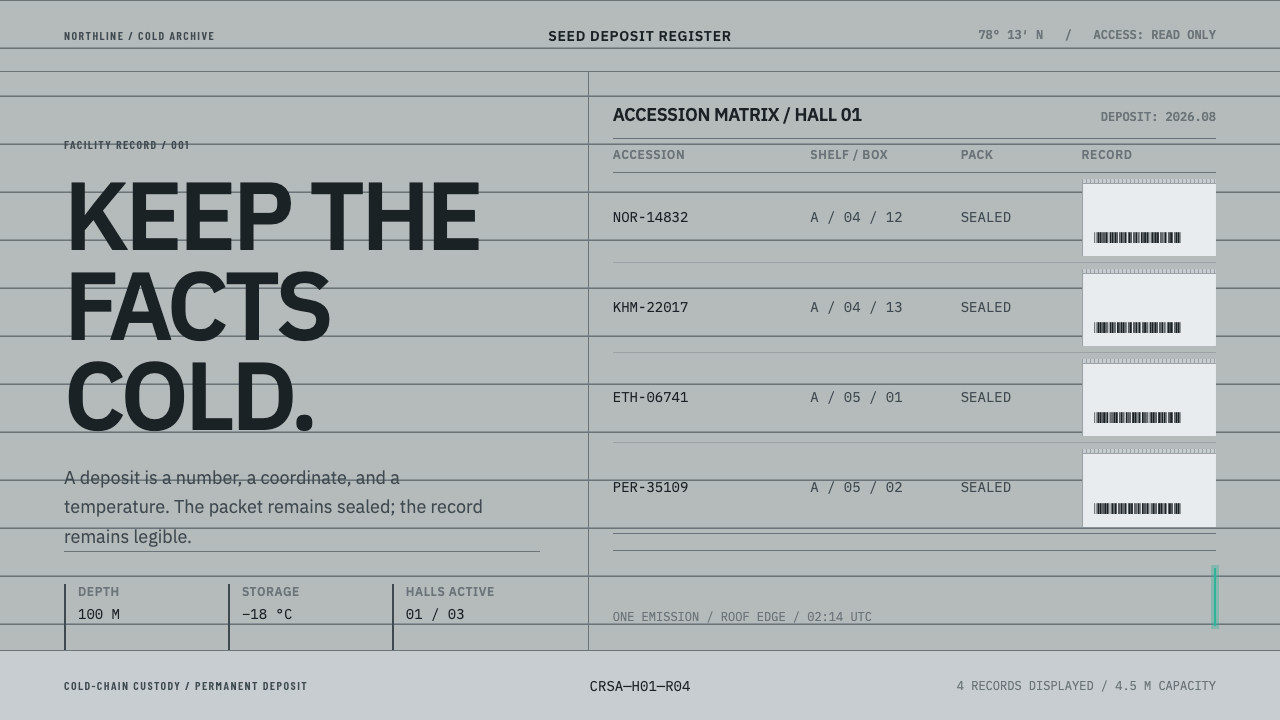 Climate Refuge Seed ArchiveFacts stay cold. Concrete-grey accession rows meet one turquoise fibre-optic…
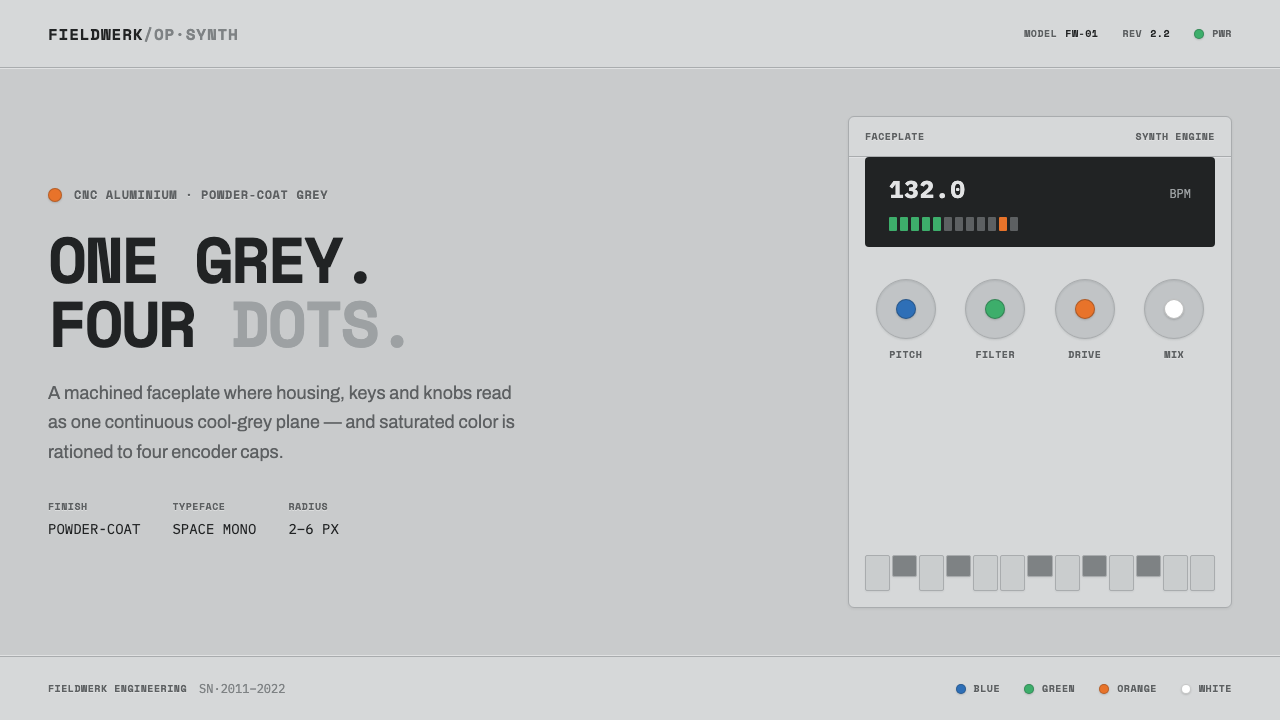 Teenage Engineering OP-1One grey, four dots. Machined aluminium in Space Mono, color rationed to tiny…
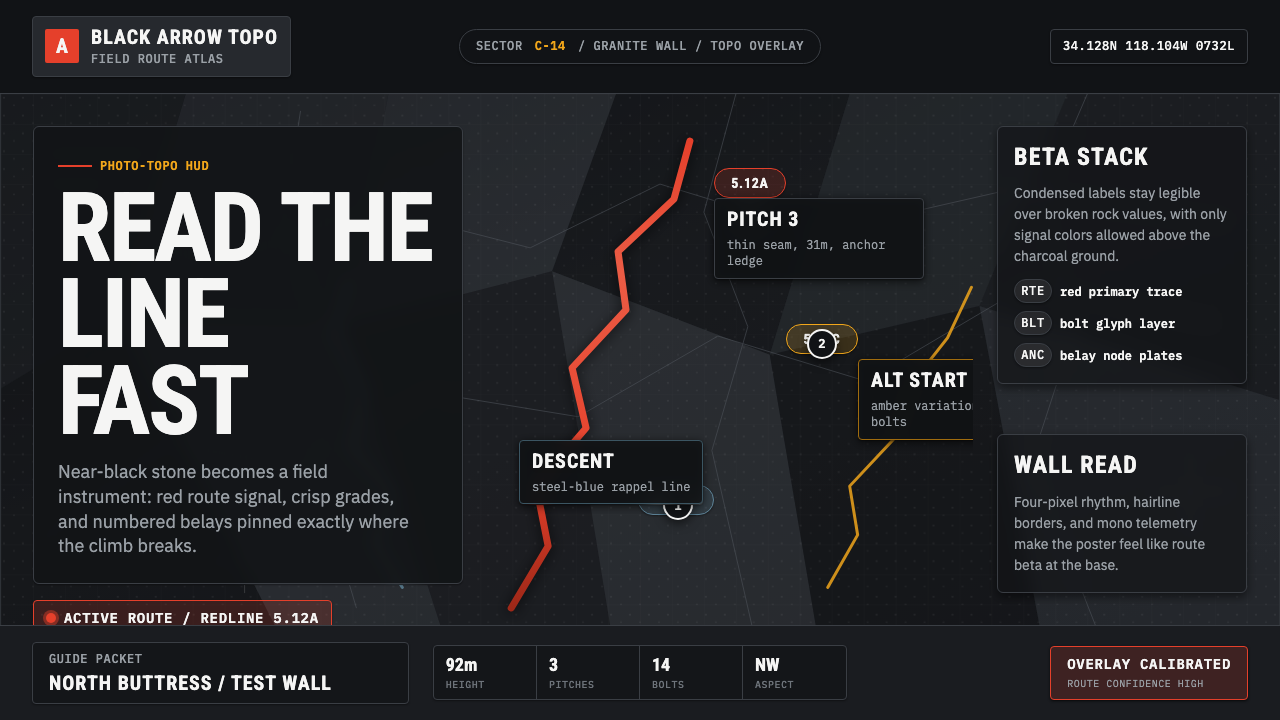 Climbing Topo GuideBeta at a glance. Red route telemetry cuts across near-black stone and conden…
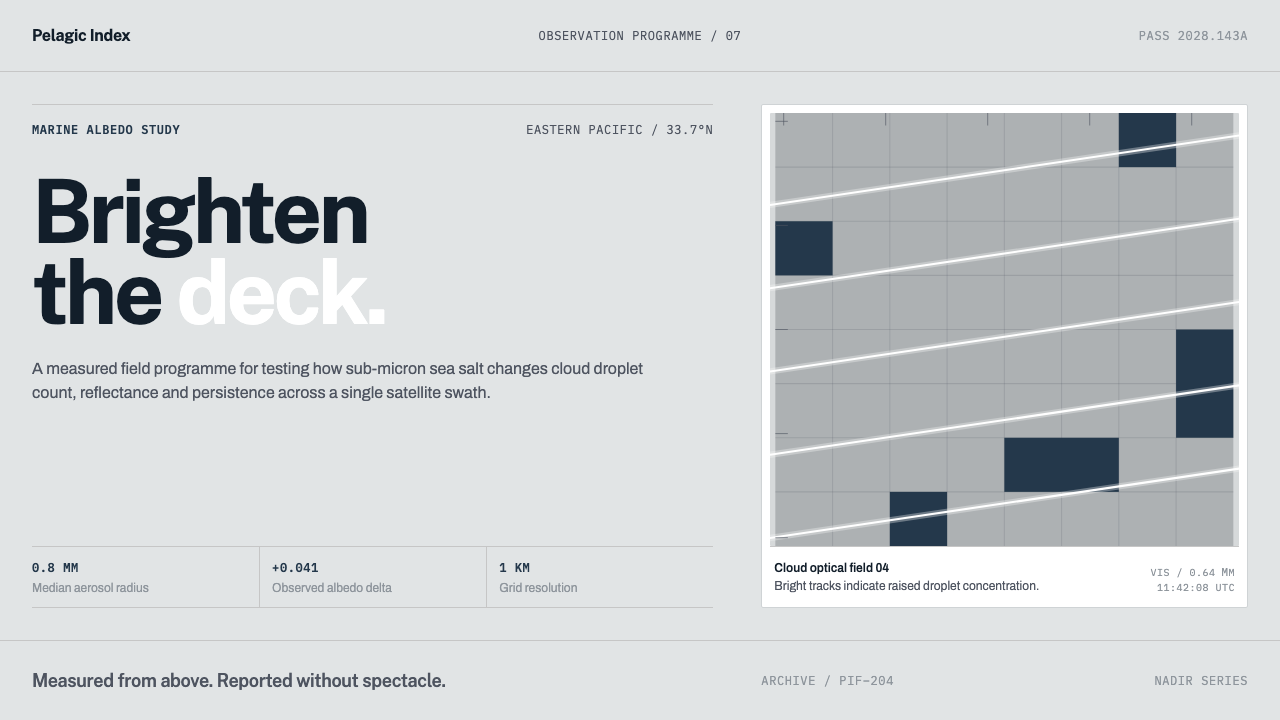 Cloud Brightening FleetBrightening becomes evidence. White ship-track lines score a cool-grey satell…
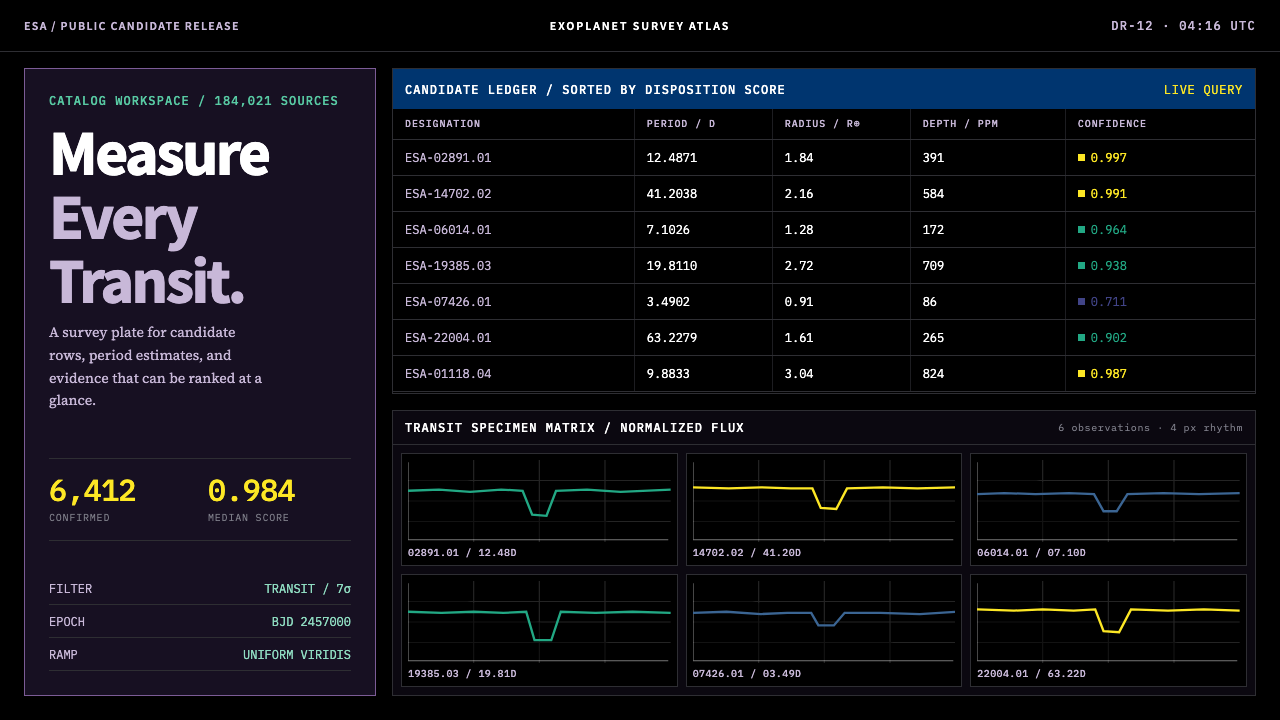 Exoplanet Survey AtlasNumbers stay legible at survey scale. Viridis ranks dense mono tables and tra…
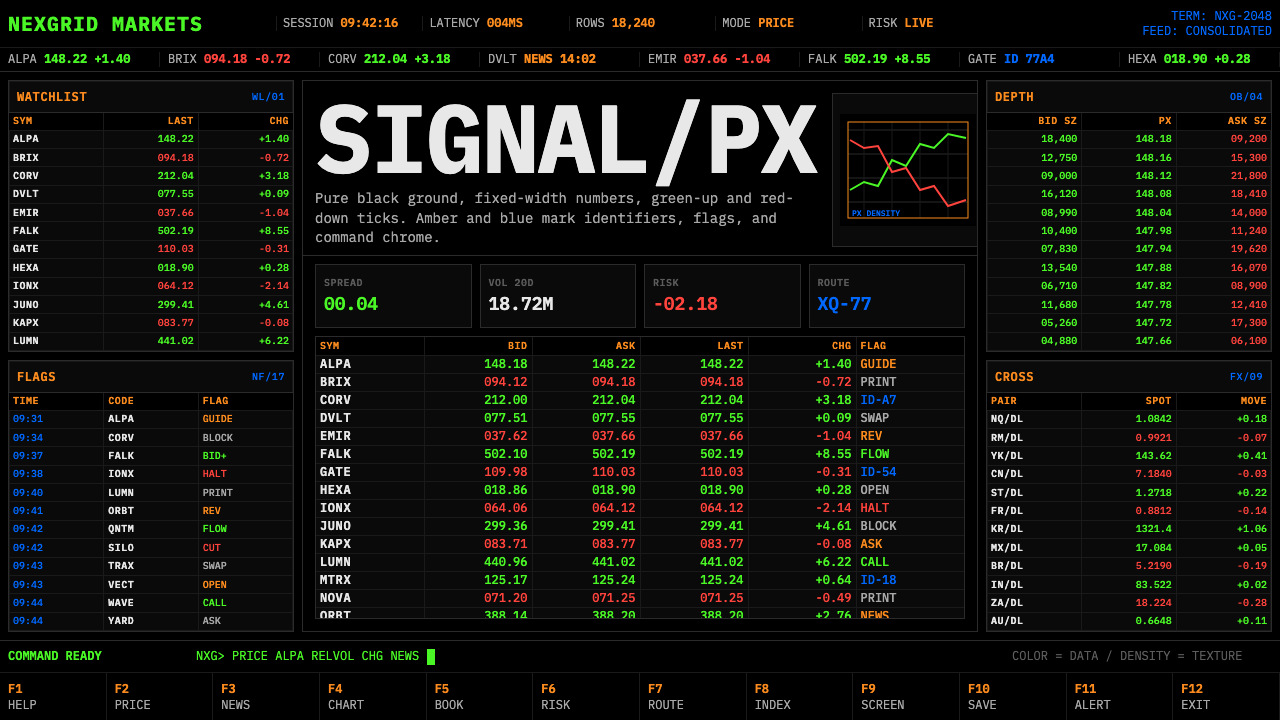 Financial Terminal MonoMaximum signal per pixel. Pure black, IBM Plex Mono, green-red ticks, amber-b…