What is Windy Wind Map?
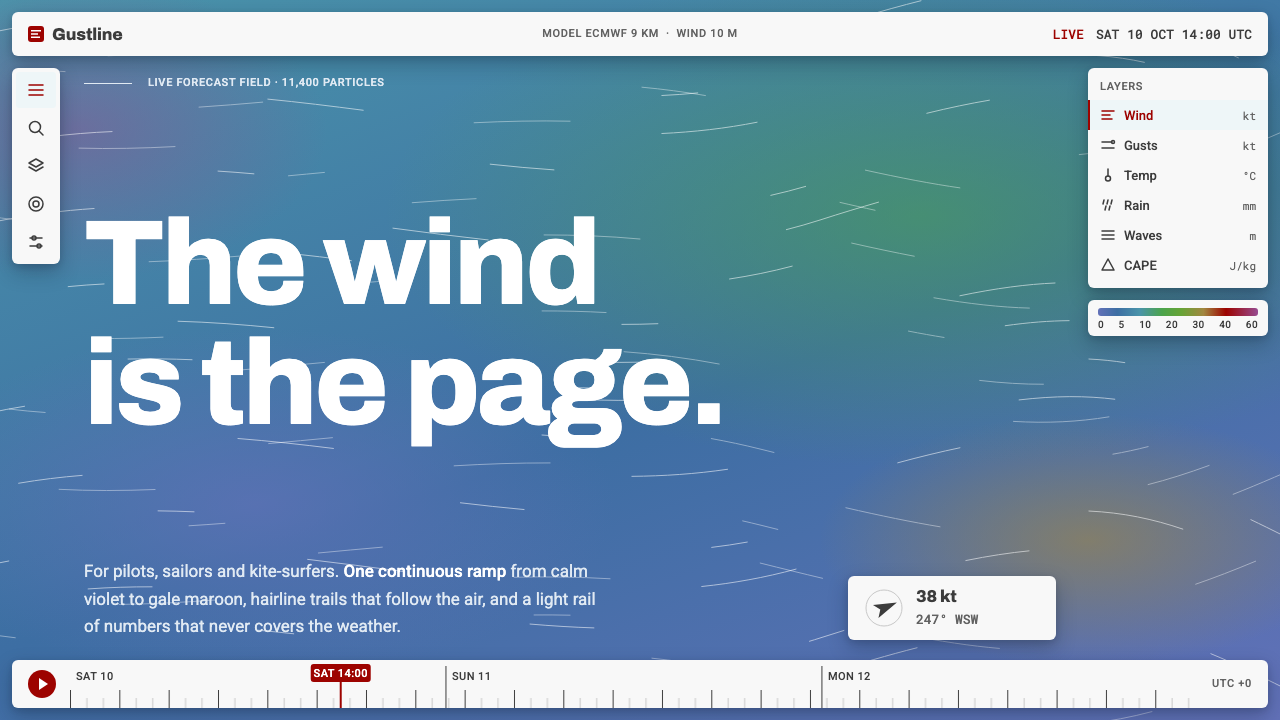
Windy has no page: the wind field itself is the ground, painted in a continuous colour ramp and streaked with thousands of hairline particle trails, with a thin light instrument rail floating above.
Windy Wind Map in brief
The Windy wind-map style is built on a single idea: the data is the background. One continuous colour ramp covers the whole globe. It is a steel blue-violet where the air is still, a steel teal over most of the ocean, then green, ochre and maroon as wind builds, and violet at the extreme. Thousands of near-white hairline trails with fading tails stream across it in the direction of the wind.
Everything else is a thin, light instrument layer pinned above the field: an icon column on the left, a layer stack on the right, a gradient legend, and a timeline scrubber along the bottom. The one typeface is Roboto, and the text on screen is mostly numbers such as knots, hours and pressure levels, kept short, tabular and constant.
The language belongs to pilots, sailors and kitesurfers, who need to read conditions quickly, rather than to a casual weather app that tells you what to wear. It suits maps, scientific visualisation, data art, forecasting and monitoring tools, and any interface where one field of data should fill the screen.

Where does Windy Wind Map come from?
Windy began in 2014 as Windyty, a website from Prague in the Czech Republic that showed a live animated map of the wind. It was renamed Windy.com in 2017. The site attracted a following because it made a normally abstract subject, the movement of air, immediately visible and enjoyable to explore. Ivo Lukačovič, the founder associated with the project, is the name most linked to its development.
A key predecessor was the earth wind map by Cameron Beccario, which popularised the sight of wind rendered as flowing particles on a rotating globe. That work helped show how WebGL could animate large vector fields smoothly in a browser. Windy took this particle-advection approach and turned it into a full forecasting product with layers, models and a timeline, so the visual idea moved from a demonstration into a daily tool.
The style draws on three traditions. The first is WebGL particle-advection visualisation, where thousands of points are moved along a vector field and drawn with fading trails to reveal flow. The second is the full-bleed map interface, in which the map takes the whole viewport and controls are pushed to the edges. The third is the scientific colour ramp, a continuous scale that encodes a measurement and comes with a legend, rather than a palette chosen for decoration.
The current visual form took shape from roughly 2019 to 2025, with a consistent light instrument rail and a refined ramp. The design system built from it keeps this structure. It treats the ramp as the foundation of the screen, uses the particles as texture and motion, and keeps the interface controls light and thin so that they never compete with the field they describe.
What defines the Windy Wind Map look?
Wind as Ground
There is no separate page background. The full-screen colour field is the data, so the page and the content are the same thing. This removes the usual frame-and-content split and makes the screen feel like looking at the atmosphere directly. Interface elements are kept small so the field always dominates.
Continuous Colour Ramp
Colour changes smoothly from a steel blue-violet for calm air, through steel teal over the sea, to green, ochre and maroon as the wind increases, and violet at the extreme. It is a measurement scale, and a gradient legend explains it. Colour is never used simply to look pretty; every change in hue means a change in value.
Hairline Particle Trails
Thousands of near-white thin lines move along the wind, each with a tail that fades out. Density and speed of motion make direction and strength readable at a glance. The lines are fine and light so that they texture the field without hiding the colour beneath.
Light Instrument Rail
Controls live in thin, light panels pinned to the edges: a column of icons on the left, a layer stack on the right and a timeline across the bottom. They are bright and flat against the saturated field, which makes them easy to find. Their job is to operate the view, never to compete with it.
Gradient Legend
A slim strip shows the colour ramp with its values, so any hue on the map can be decoded. It sits in a fixed place and uses the same ramp as the field. The legend is what turns the picture from an illustration into an instrument.
Timeline Scrubber
A strip along the bottom lets users move through forecast hours, with small ticks for time steps. Dragging it re-renders the field and the motion changes with it. Time is a first-class control, because forecasts only make sense with a moment attached.
Roboto Numerals
One typeface, Roboto, carries all the text. Values are short and tabular, with units kept small beside them. Hierarchy comes from weight and brightness rather than from changes of typeface. The text is meant to be read in a glance on a moving boat or in a cockpit.

Who shaped Windy Wind Map?
Lukačovič is the founder associated with Windy, which began as Windyty in 2014 and became Windy.com in 2017. His name is linked to turning a wind-visualisation idea into a widely used forecasting service from Prague.
Beccario created the earth wind map that popularised wind drawn as flowing particles on a globe. His work is an important precedent for the particle-advection look and for showing that large vector fields could animate smoothly in a browser.
How do you use Windy Wind Map today?
This style is most effective when one continuous dataset deserves the whole screen. It works for weather and ocean tools, air-quality maps, energy and traffic flows, scientific explainers, data art and any interface where motion shows a field. It is not suited to text-heavy pages or to content that has no spatial dataset to show.
For presentation slides, a cover can be a full-bleed colour field with a few thin particle trails and the title set in light type on top. Content slides keep that field as the background and place one clear number or short statement in light type. Data slides use the same ramp as the chart colouring, with a legend strip, so that colour always means value.
For web interfaces, make the main view full-bleed and keep chrome minimal. A narrow icon column on one side, a layer stack on the other and a timeline along the bottom is the pattern. Panels are thin and light, and they carry short labels and numerals in a single typeface. Avoid cards, large headers and decorative sections that would cover the field.
For editorial and marketing work, use the field as the hero image and let a small amount of text sit above it. Captions can be short, factual and numeric. If you animate, make it slow, continuous flow rather than sudden effects. A still image with a few trails still carries the identity, so the style survives in print.
A common mistake is to use the ramp as decoration, with arbitrary hues that do not match any legend. Another is to put heavy panels or large type over the field, which hides the very data the style exists to show. A third is to mix several typefaces, since a single plain face keeps the instrument feeling coherent.

Windy Wind Map — FAQ
What does the colour ramp mean?
It encodes wind strength. Calm air sits at the steel blue-violet end, most open ocean falls in steel teal, and as wind builds the colour moves through green, ochre and maroon, reaching violet at the extreme. A gradient legend accompanies it so any hue can be read as a value.
Do I need animation to use this style?
Motion is part of the original, since the particles show flow. But the identity also holds in still form: a full-bleed ramp, a few fine trails and a light instrument rail are enough. If you animate, keep it slow, continuous and subordinate to the data.
Can I add cards and big headings?
It is better not to. The point of the style is that the field is the page. Large panels and headings cover the data and turn the screen back into a conventional layout. Keep text small, numeric and in thin panels at the edges.
Who is this style for?
It is built for people who read conditions in real time, such as pilots, sailors and kitesurfers, and it translates well to any expert tool where one dataset fills the view. It is less suited to a casual product that only wants a friendly summary.
Why use only one typeface?
Because the screen is mostly short numbers and labels that must be read quickly. A single plain face, Roboto, keeps digits consistent and the interface quiet, which lets the colour field remain the only expressive element.
Related design styles
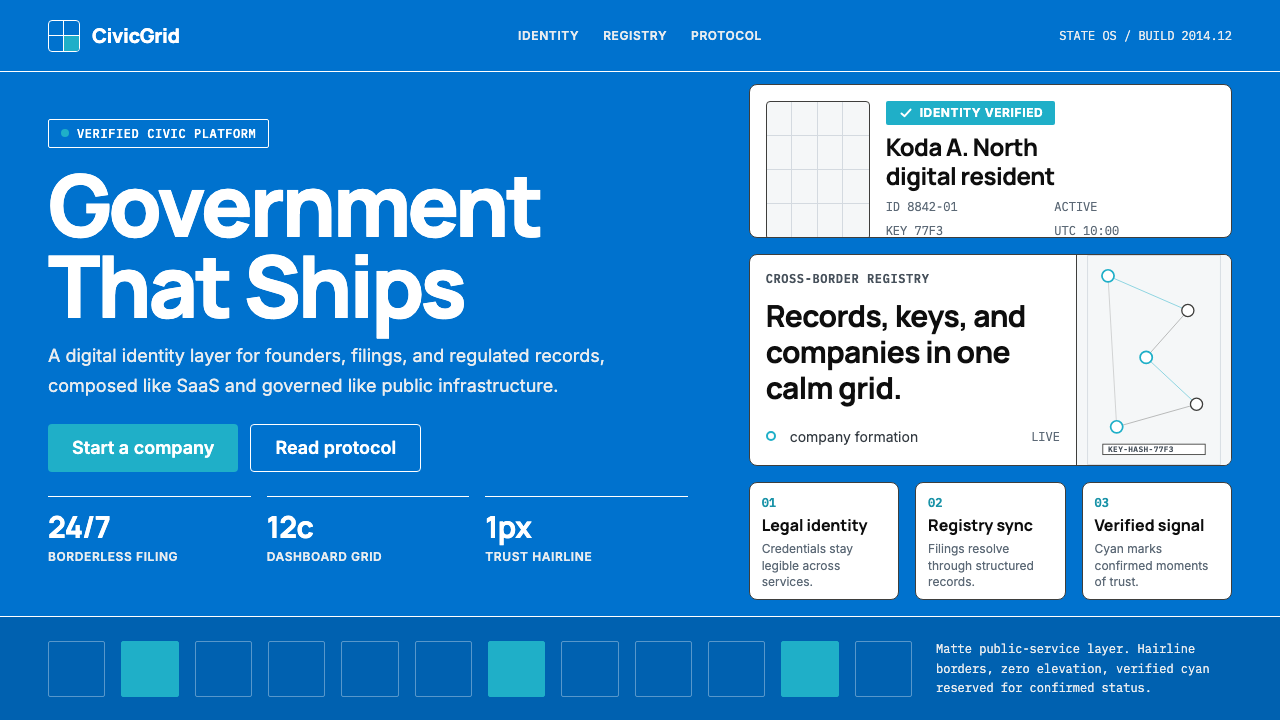 Estonia e-Residency Digital (2014)Trust without weight. Cornflower blue, 12-column grids, and cyan verified sig…
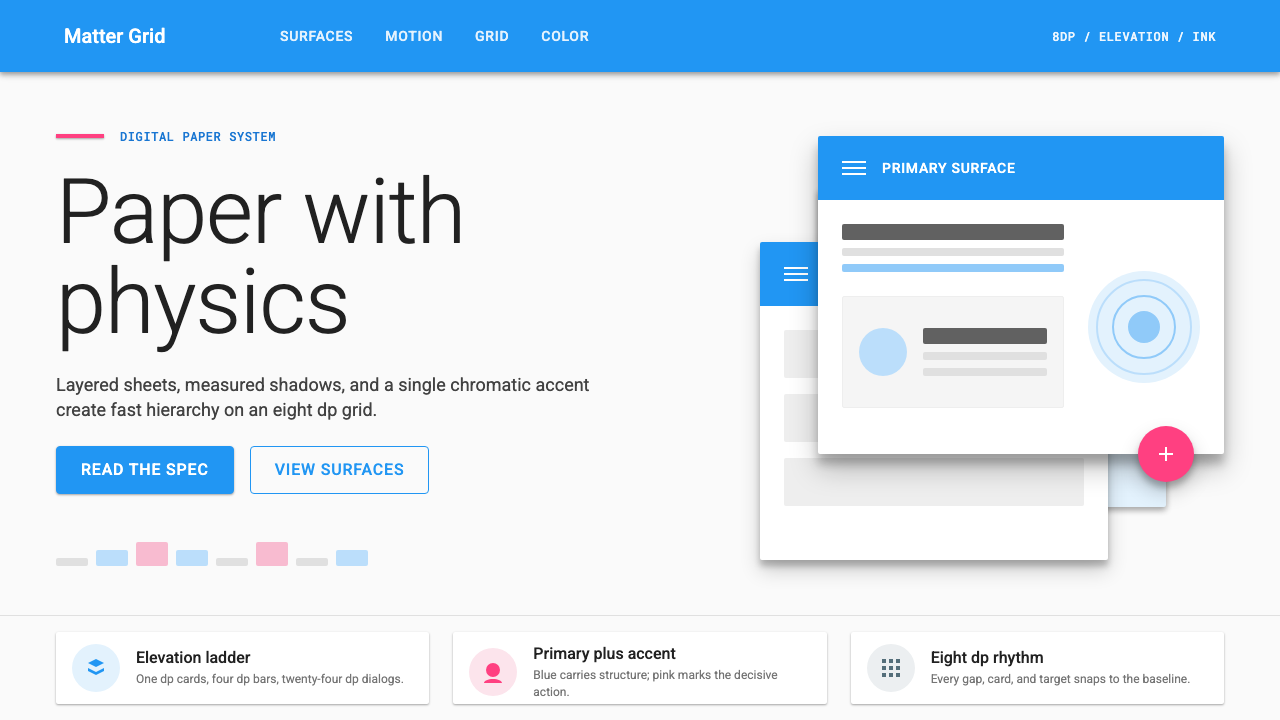 Material Design 1.0Depth made flat usable. Blue app bars, pink FABs, 8dp grids, and crisp paper…
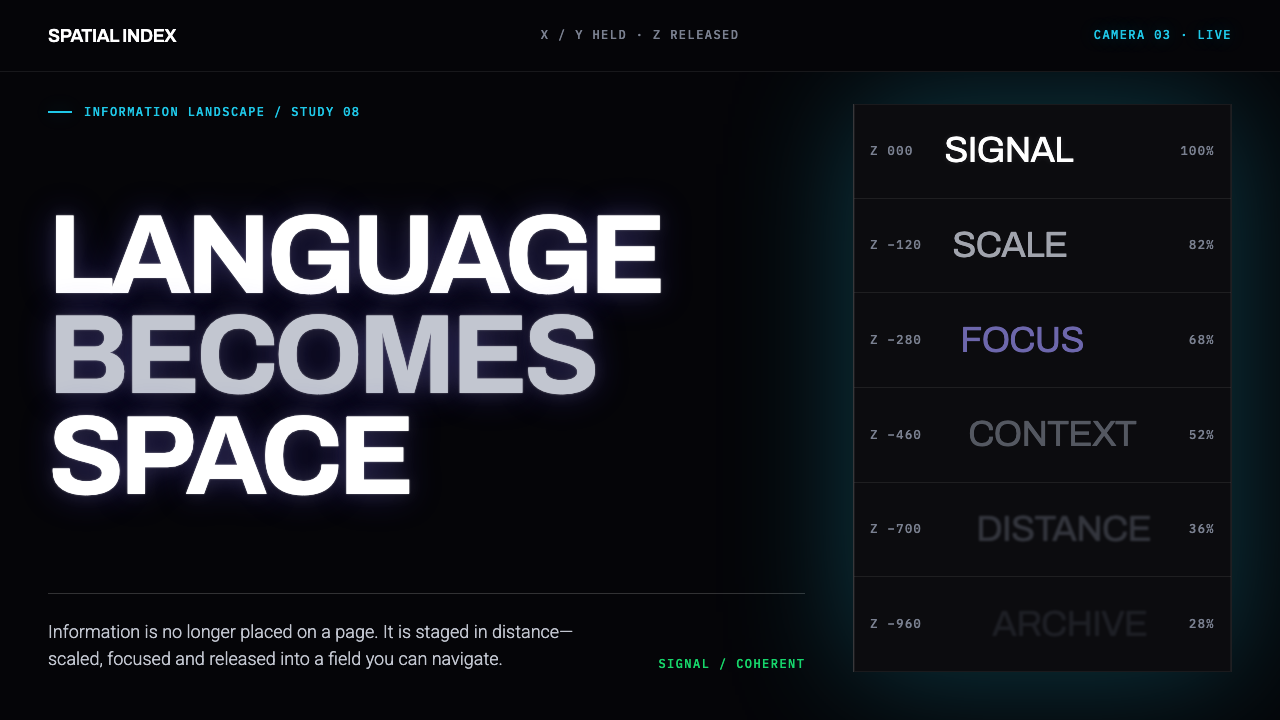 Muriel Cooper MITType escapes the page. White grotesque recedes through emissive black in laye…
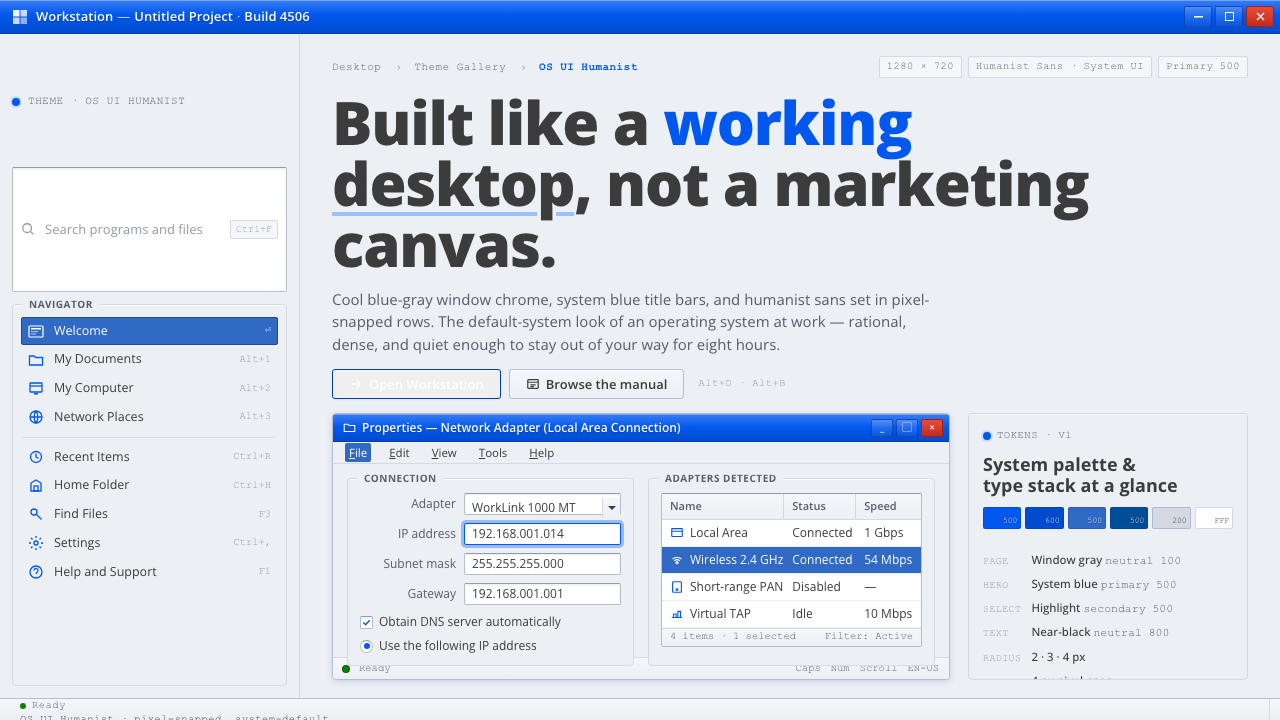 OS UI HumanistBuilt like a working desktop, not a brand. Window-gray ground, system-blue ch…
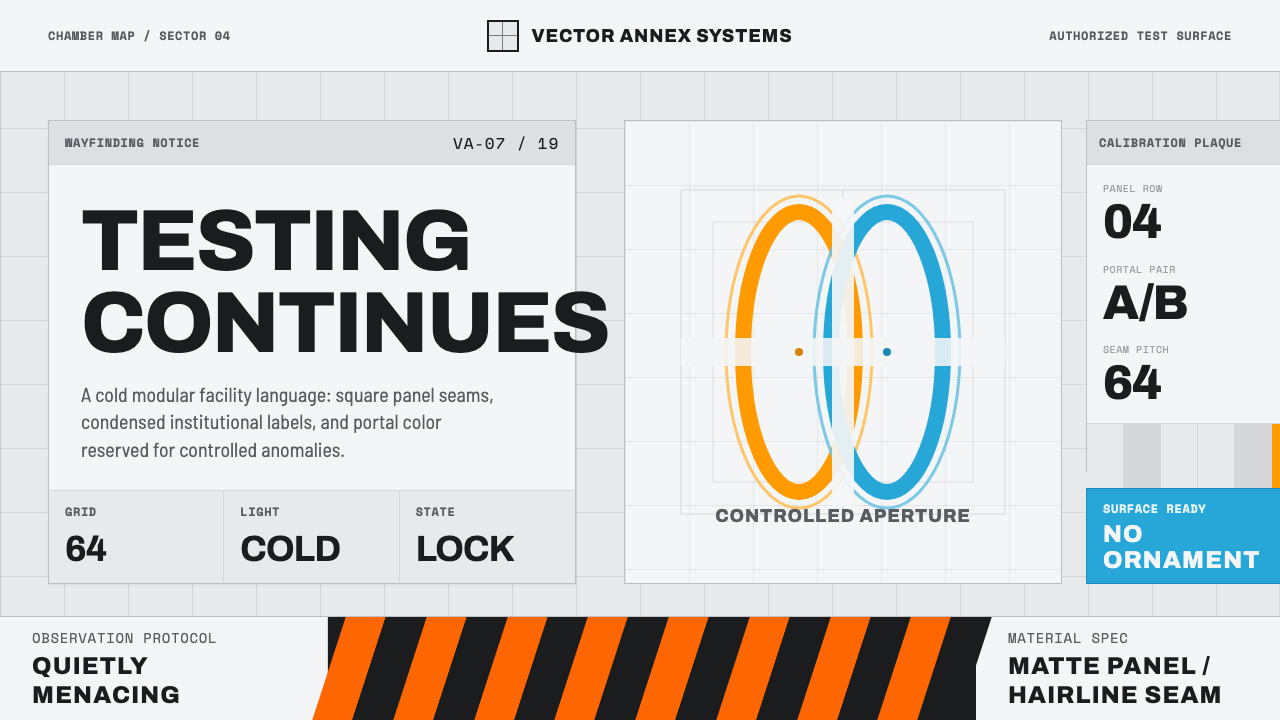 Aperture ScienceSterile authority. Cool panel seams, Archivo signage, and sparse orange-blue…
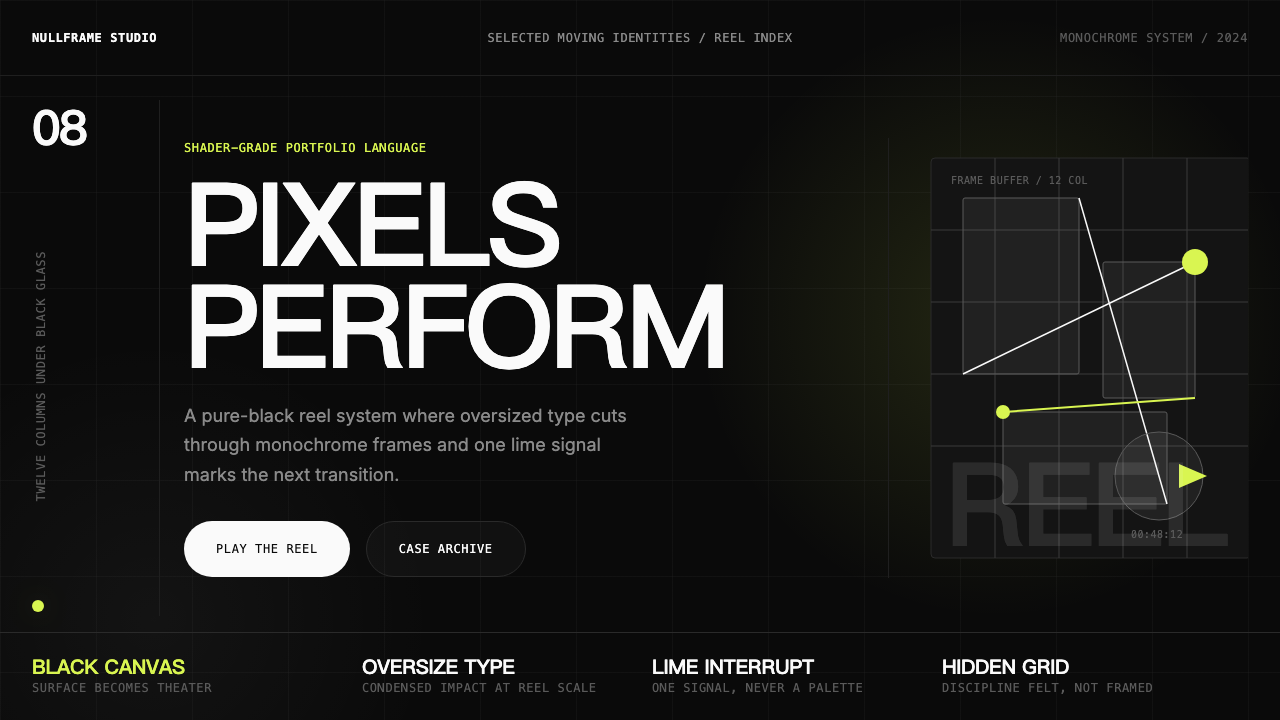 Awwwards Swiss PortfolioCinema, not interface. Black canvas, huge condensed type, and one lime signal…