What is Personal Genome Report?
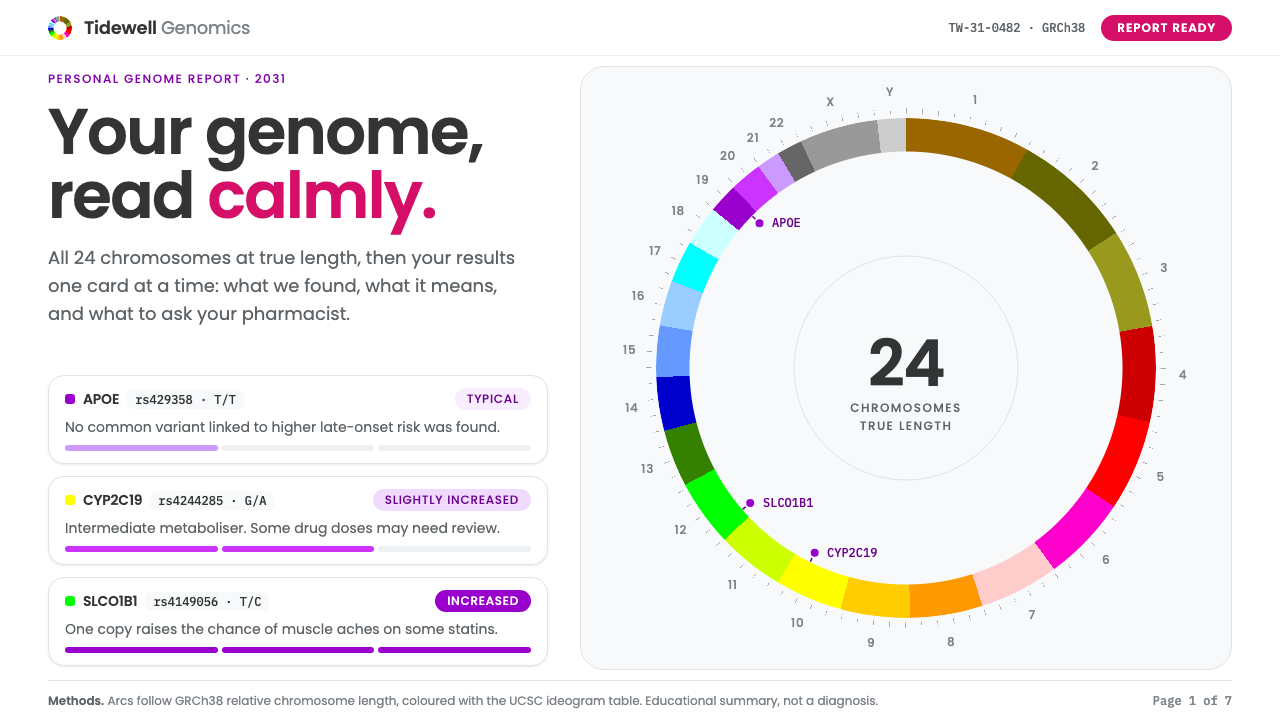
Personal Genome Report imagines the genetics report you might open in 2031: a chromosome ring in genome-browser colours leading into calm, purple-tiered result cards that explain rather than alarm.
Personal Genome Report in brief
Personal Genome Report is a speculative design style set in 2031, built by placing two real visual traditions on one white page. The upper half borrows the Circos chromosome ring, a circular diagram in which every chromosome becomes an arc, coloured with the table of hues used by the UCSC Genome Browser for chromosome ideograms. The lower half borrows the layout of consumer genetics reports popularised by 23andMe: pale grey panels, friendly geometric type, and results broken into cards that you read from top to bottom.
The ring shows all 24 chromosome types, the 22 numbered autosomes plus X and Y, at their true relative lengths, so the longest arc is visibly longer than the shortest. Below it, results are grouped into tiered risk cards, metaboliser cards for how the body processes medicines, and a pedigree chart that follows one variant through several generations. Gene names, variant identifiers, and genotypes are written out in full, as real reports do.
Above all, the tone is calm, not clinical. Health information about your own body is inherently emotional, so the style avoids red alarm colours, ominous icons, and the glowing double-helix clichés that stand in for science in so much stock imagery. Its purple tiers say how much attention a result deserves, in plain words, without ever raising its voice.

Where does Personal Genome Report come from?
The style rests on a date and two precedents. The date is 2031, a deliberate act of speculation: the report you might open a few years from now, when reading your genome is as ordinary as reading a lab result. The precedents are Circos, published in 2009, and the consumer genetics report that 23andMe made familiar from 2007 onwards through the 2020s. The design joins a scientific figure to a consumer product, two visual cultures that rarely share a page.
Circos was created by Martin Krzywinski, a scientist and designer working in Vancouver, British Columbia. The tool arranges data around a circle, which makes it possible to show an entire genome, its features, and the links between distant regions in one compact figure. It spread quickly through genomics papers and eventually became a recognisable emblem of the field. The ring in this style inherits its circular grammar: start at the top, travel clockwise, and read the genome as a single object.
The colours come from a second institution, the UCSC Genome Browser team at the University of California, Santa Cruz. Their ideogram colour table, developed in the 2000s, assigns each chromosome and its banding a particular hue, which gave researchers a shared visual vocabulary. Using that table, rather than inventing a palette, anchors the report in real practice: a reader who has seen a genome browser will recognise the colours instantly.
The consumer layer connects to direct-to-consumer genomics and to pharmacogenomics, the study of how genetic variation changes the way people respond to medicines. Anne Wojcicki, co-founder of 23andMe, based in Sunnyvale, California, is the figure most associated with turning a genome into a friendly report that an ordinary person could read at the kitchen table. The third movement, circular genome visualisation, completes the lineage. Together these give the style a clear job: to make complicated personal data legible and humane.
What defines the Personal Genome Report look?
The chromosome ring
The ring is the opening image. Twenty-four arcs sit around a circle in order, each at its true relative length, each in its genome-browser hue, separated by small gaps. It is not decoration but data: the long arcs of the early chromosomes and the short arcs of the late ones are meant to be visible, and the ring holds the centre of the page with a generous white margin around it.
Color
There are two color systems and they are kept apart. The ring uses the UCSC ideogram table, a varied, slightly muted set of hues that identify chromosomes. Everything below the ring uses restrained white, pale grey, and a family of purples that signal tiers of attention. Warning reds and oranges are avoided; the report should never look like an alert.
Tiered result cards
Results are sorted into three plain tiers: typical, slightly elevated, and higher. Each card carries a purple tier marker, a one-line summary in ordinary language, and then the gene, variant identifier, and genotype for those who want detail. The layering lets a reader take in the headline first and the evidence second.
Typography
Type is a friendly geometric sans in the manner of consumer health products: round letterforms, even spacing, and a gentle hierarchy. Gene symbols and variant identifiers are set apart, typically in a monospaced or tabular style, so that technical strings read as strings. Headlines speak in short plain sentences.
Panels and surfaces
Panels are pale grey on a white page, with soft edges and minimal shadow. The effect is of well-organised paper in a folder, not a medical monitor. Sections are separated by space and tone rather than by heavy rules, so the page can be read slowly without ever feeling like a form to be filled in.
Metaboliser cards
Pharmacogenomic results are expressed as how the body tends to process a medicine: slower, typical, or faster. These cards use short phrases, small scales, and the same purple family, and they always end with a plain suggestion to discuss results with a clinician. The design makes it clear that information supports a conversation instead of replacing one.
Pedigree chart
A pedigree chart follows one variant across generations using the conventional symbols of genetics, with thin lines, open and filled shapes, and small labels. It is drawn in the same restrained palette as the rest of the page. It turns an abstract inheritance pattern into a family story, which is where genomics becomes personal.

Who shaped Personal Genome Report?
Creator of Circos and a longtime practitioner of data visualisation in genomics, working in Vancouver, British Columbia. His circular layout is the structural backbone of the ring that opens every report in this style.
The group at the University of California, Santa Cruz that maintains the genome browser and its ideogram colour table. Their hues give the ring a vocabulary that working biologists already recognise.
Co-founder of 23andMe, the company most associated with bringing genetic reports to ordinary consumers. The pale panels, friendly type, and card-by-card reading order of this style descend from the consumer report tradition her company helped establish.
How do you use Personal Genome Report today?
For slides, Personal Genome Report suits healthcare, biotechnology, wellness, and research communication. A cover can place the chromosome ring at the centre of a white slide with a short plain title beneath it. Content slides work as single cards: one tier, one finding, one sentence of explanation. Use the ring again as a recurring motif, perhaps smaller, to orient the audience in a longer deck.
For data slides, keep the hierarchy of headline first and evidence second. Show a result as a tier marker and a plain sentence, with the technical detail set beneath in a smaller, quieter line. Charts should use the genome-browser hues only when they actually refer to chromosomes; elsewhere, use the purple family and pale greys so that colour keeps its meaning.
For web interfaces, the style fits patient portals, health dashboards, lab-result viewers, genetic counselling tools, and any product that must show sensitive personal information gently. Cards are stacked in a single column on narrow screens, the tier markers stay visible, and expandable detail lets curious readers go deeper. Always pair a result with a next step or a pointer to professional support.
For editorial and marketing work, it supports explainers, science journalism, onboarding for health products, and thoughtful brand pages for genomics companies. Write in the second person, in plain words, and explain jargon on first use. Imagery should be the ring, the pedigree, and the report itself; avoid glowing helices, lab-coat stock photos, and anything that dramatises risk.
The common mistake is to let the style turn clinical or frightening: red tiers, heavy warning icons, bold alarmist headlines. Another is to colour the ring arbitrarily, which breaks the connection to real genome-browser practice and misleads trained readers. Keep the ring true to length and hue, keep the tiers in purple, and let every result arrive with calm context.

Personal Genome Report — FAQ
What are the two visual sources behind this style?
One is Circos, the circular genome visualisation published in 2009, whose ring is coloured here with the UCSC Genome Browser ideogram colour table. The other is the consumer genetics report layout familiar from 23andMe, with pale grey panels, friendly geometric type, and results in cards. The style joins a scientific figure to a consumer interface.
Why is the year 2031 in the name?
It marks the style as speculative: a design for the genetics report you might open in the near future, when personal genomes are routine. It is not a historical style but an imagined one, built from real ingredients, which lets it explore tone and clarity without being tied to any single existing product.
Why are the risk tiers purple instead of red?
Because red signals danger, and genetic information is rarely a simple alarm. Purple tiers communicate how much attention a result deserves while keeping the page calm. The style's central promise is that it informs without frightening, so it avoids the colours and icons that normally trigger anxiety.
Do the chromosome arcs have to be accurate?
Yes, within reason. The ring is meant to show all 24 chromosome types at their true relative lengths, in the genome-browser hues. Accuracy is what gives the ring credibility with trained readers. If your use case is only decorative, you can simplify, but the style works best when the ring stays faithful to real data.
Where does it work best, and where should I avoid it?
It works best for health, biotech, research communication, and any product presenting sensitive personal data with care. Avoid it for high-energy entertainment, aggressive sales pages, or contexts that need urgent, high-contrast alarms. Its strength is calm clarity, and it will feel wrong wherever the goal is excitement or pressure.
Related design styles
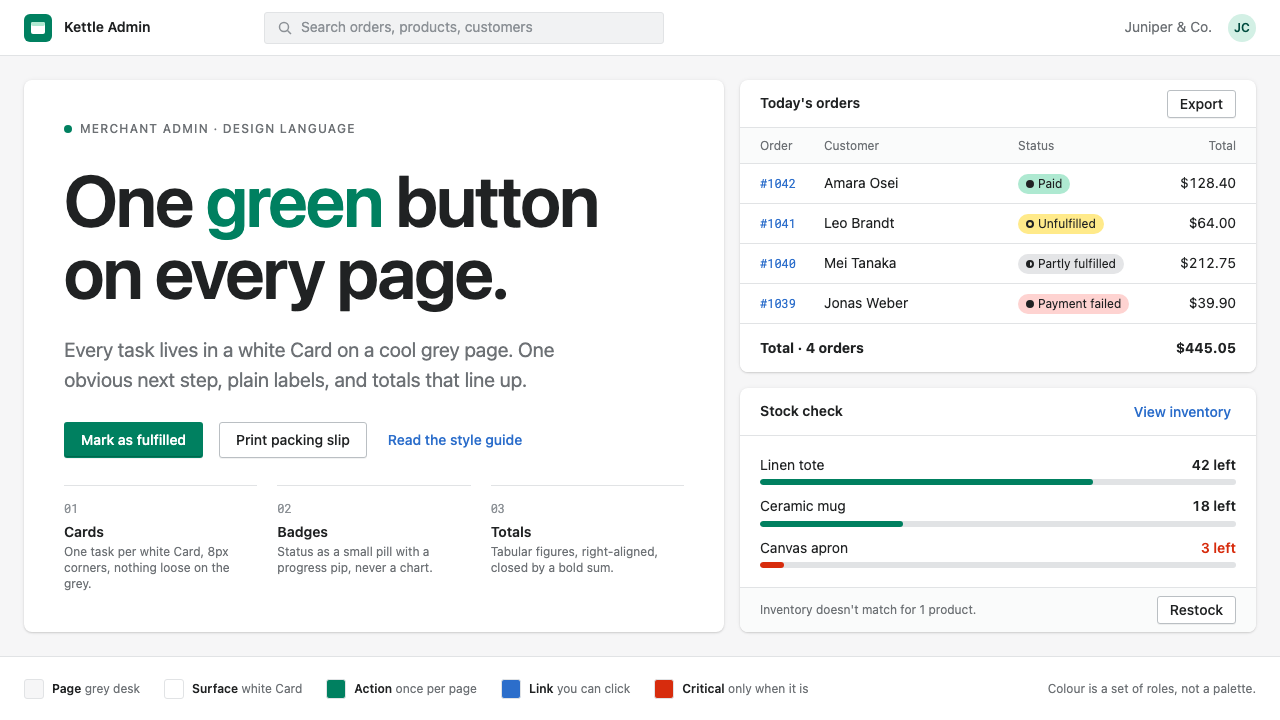 Shopify PolarisOne task per Card, one green button per page. White Cards on cool grey, pill…
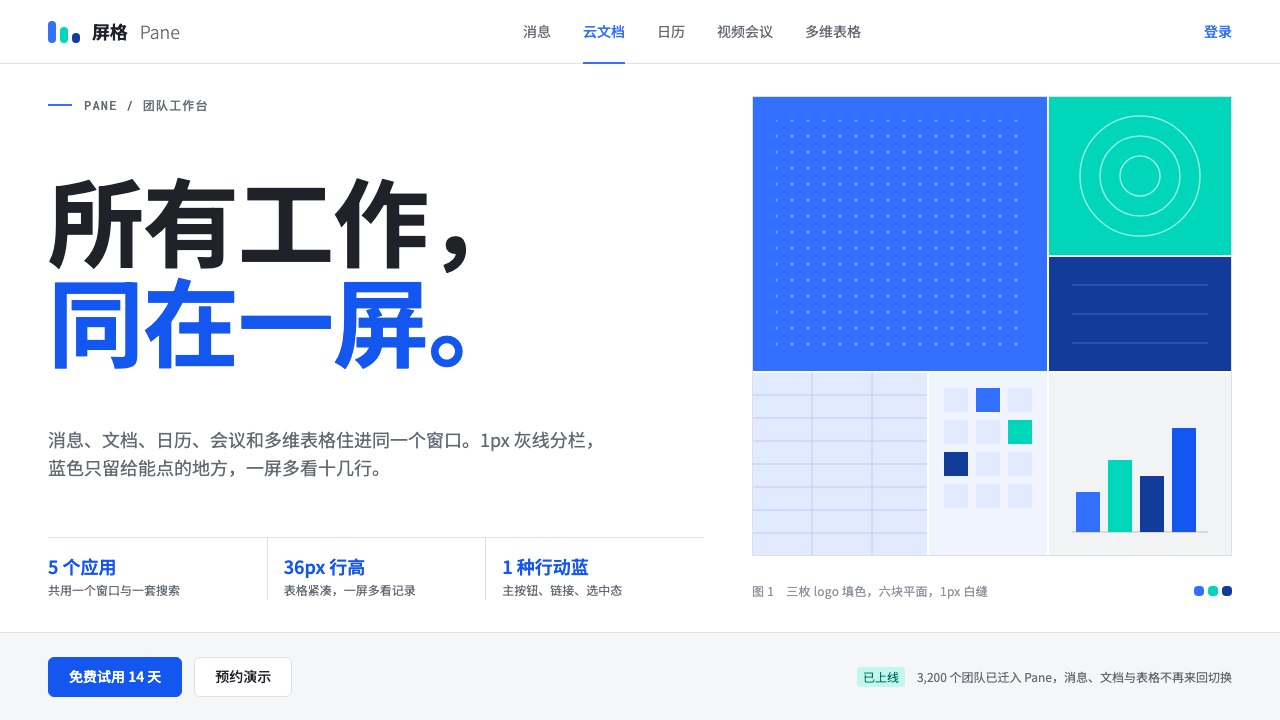 FeishuQuiet density, one blue. White panes split by 1px grey lines; blue marks only…
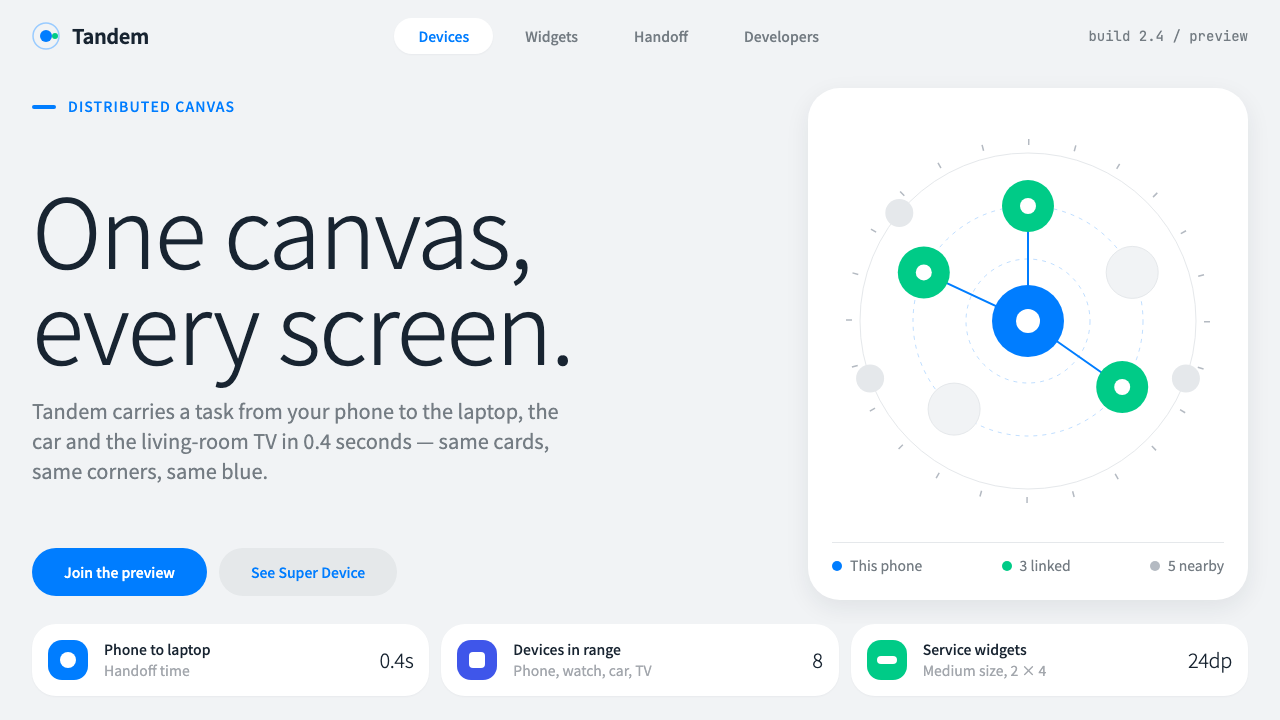 HarmonyOSOne blue for everything you can touch. White 24px cards on cool grey, navy te…
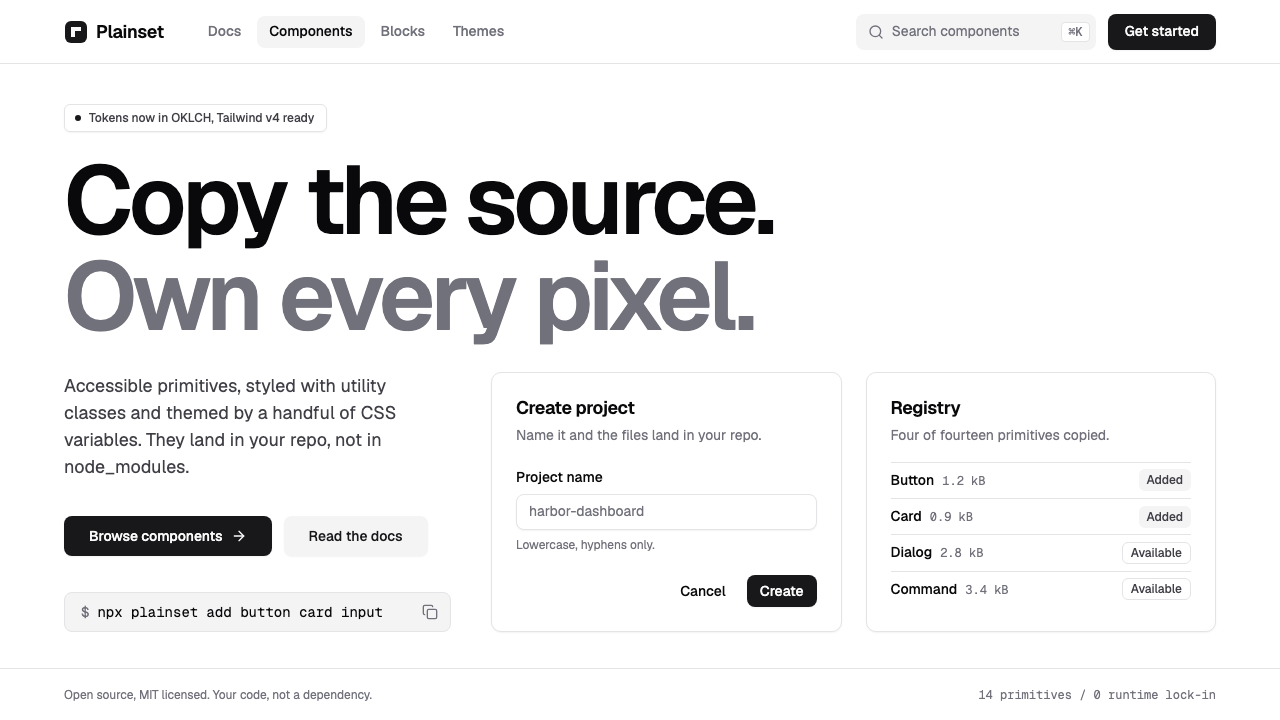 shadcn/uiQuiet enough to disappear. White pages, zinc hairlines, one near-black button…
 Shopify ModernMerchant ally, not corporate SaaS. Emerald actions on bordered white cards ca…
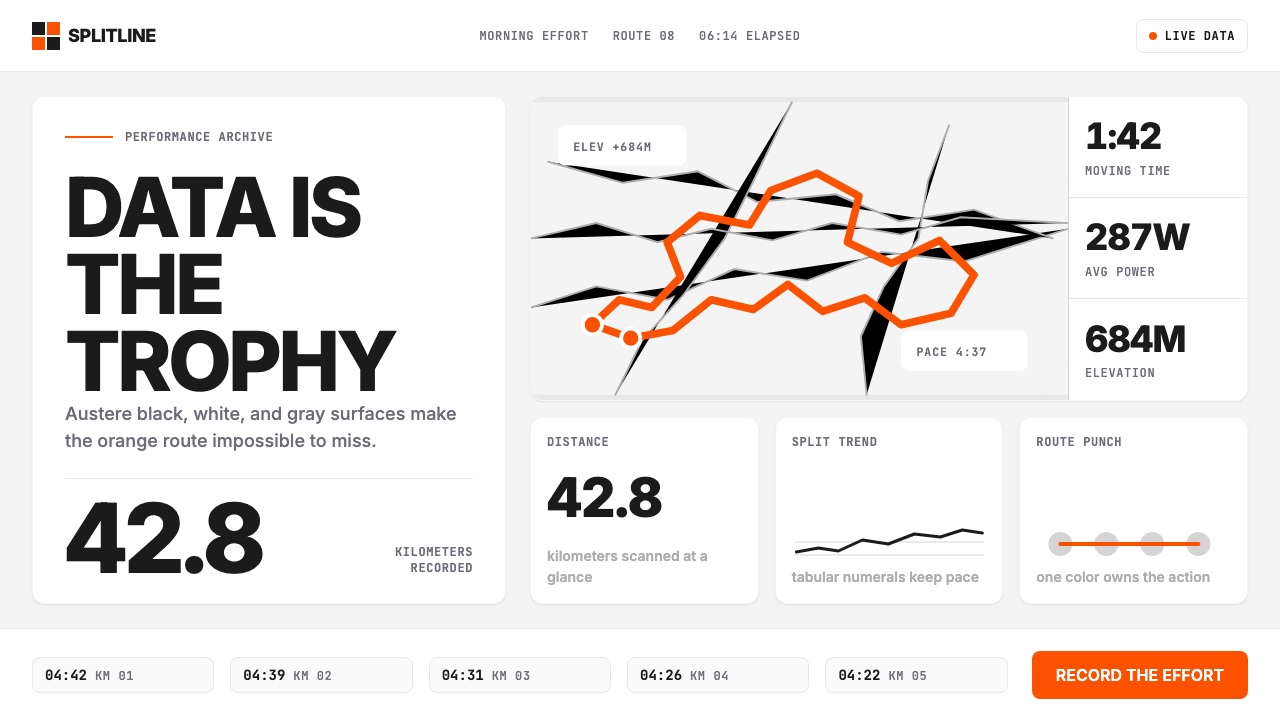 Strava Orange FitnessData becomes trophy. Inter numerals, gray metric grids, and one orange route…