What is Isometric Illustration?
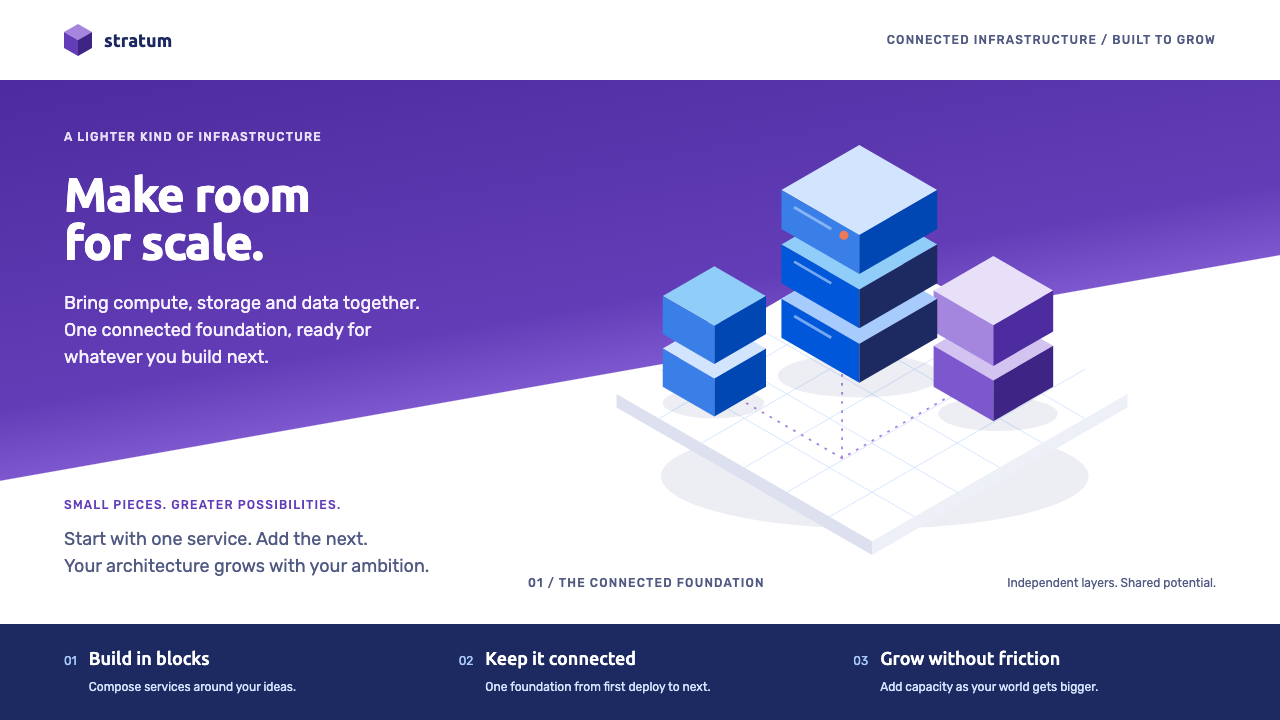
Isometric SaaS illustration is the look of the late-2010s tech homepage: servers, phones and tiny figures stacked on a thirty-degree grid beneath a diagonal violet gradient.
Isometric Illustration in brief
Isometric illustration is a drawing method in which three-dimensional objects are shown at fixed angles, with no perspective shrinking, so that every cube and platform keeps the same scale wherever it sits on the page. In the late 2010s it became the default way to explain abstract software: servers, phones, charts and small human figures drawn as chunky blocks and stacked into floating platforms.
The style is most associated with the period from about 2016 to 2019, peaking around 2018, when SaaS companies, crypto projects and agencies seemed to share the same visual vocabulary. A typical page had a headline on the left, a large isometric scene on the right, and a diagonal band of violet gradient cutting across the background to give the whole composition a sense of lift.
Its appeal is that it makes complexity feel light. A data pipeline, a payment flow or a security layer can be drawn as a tidy stack of tiles, each face lit in a slightly different blue, and the viewer immediately understands that there are layers, connections and a system. The style promises order and calm, which is exactly what software marketing needs to say.

Where does Isometric Illustration come from?
Isometric projection itself is old, a standard method in technical and architectural drawing for showing objects without the distortion of perspective. What changed in the late 2010s was its migration into marketing. Teams that needed to illustrate invisible products found that isometric scenes were easy to produce, easy to scale and endlessly flexible: a block can be a server, a database, a building or a gift box.
Several currents fed the trend. Technology companies such as IBM Design helped normalise bold, geometric illustration in enterprise contexts. Studios and illustrators, including those behind names such as Optima Ninja and Psych, produced large libraries of ready-made scenes, and crypto projects such as Syscoin adopted the same visual shorthand on their landing pages. Once a few high-profile sites had done it, thousands of others copied the formula.
The look also sat inside a broader moment in flat illustration. The so-called Corporate Memphis wave of simple, friendly, flat figures had already taught audiences to accept stylised people in place of photographs, and isometric work added a sense of structure on top of it. Around 2018 the gradient revival arrived as well, and the colour of the year for 2018, Ultra Violet, gave tech brands a perfect shade of purple to attach to their identity.
By the early 2020s the style had become a cliché, and many brands moved to hand-drawn, photographic or three-dimensional alternatives. It nevertheless remains a very efficient solution for explaining systems and layers. This design system rebuilds the language as reusable rules: violet for actions, cobalt and sky blue for the lit faces of blocks, navy for depth and a single coral accent, so the style can be applied consistently rather than copied page by page.
What defines the Isometric Illustration look?
Thirty-degree isometric grid
Everything is drawn on a grid with edges running at thirty degrees to the horizontal. There is no vanishing point, so objects stay the same size however far back they sit. This gives the illustration its tidy, diagrammatic character, and it is the single rule that must be respected: break the angle and the scene stops reading as isometric.
Violet gradient band
A diagonal band of gradient, moving from a deep violet to a lighter, more electric tone, cuts across the hero area. It supplies energy and direction, and it is the colour most closely tied to the era's tech branding. Action buttons and key links pick up the same violet so that the whole page feels connected.
Blue block faces
Each block has three visible faces, lit in cobalt, sky blue and a deeper navy to suggest light from one direction. This three-tone shading is cheap to produce and instantly readable, and it lets complex stacks remain clear because each face has a defined role: top, left and right.
One coral accent
Against all this violet and blue, a single warm coral appears sparingly on status lights, badges or a small figure's clothing. Because it is the only warm colour, it draws the eye instantly, and the restraint is what keeps the palette from looking busy.
Rounded geometric sans
Type is set in friendly geometric sans-serifs with round bowls and open forms. Headings are bold and tight enough to feel confident, while body text stays plain. The letterforms echo the simplicity of the blocks, and nothing in the type distracts from the illustration.
Soft long shadows and slow drift
Platforms cast a soft, extended shadow on the ground beneath them, and in motion they drift gently up and down. These two details are what make the blocks feel airborne instead of heavy. The movement should be slow and smooth, closer to a breath than to a bounce.

Who shaped Isometric Illustration?
IBM Design is a reference point for how a large technology company adopted geometric, brightly coloured illustration for enterprise communication. Its example helped make the visual language of structured blocks and bold colour feel credible in contexts that were previously dominated by stock photography.
Optima Ninja is named among the studios associated with the genre, a reminder that much of the style's spread came from agencies and illustration teams producing scenes for client websites. Their work is part of how isometric scenes became a standard deliverable in startup marketing.
Psych is another name linked with the era's illustration output. Citing it here points to the wider culture of small studios and independent artists whose shared scenes and techniques gave the style its recognisable consistency across thousands of sites.
Syscoin represents the crypto side of the trend. Blockchain projects needed to explain abstract networks and transactions to non-technical audiences, and isometric illustration offered a friendly, orderly way to do so. Their landing pages are an example of how widely the visual formula travelled.
How do you use Isometric Illustration today?
Isometric illustration is best used when the subject is a system: layers, connections, flows or stacks. Before reaching for the style, ask whether the thing you are explaining has parts that can be drawn as blocks. If it does, the style adds clarity; if it is an emotional or human subject, it will probably feel cold.
For presentation slides, use a single isometric scene on a cover, with the headline beside it and the violet band across the background. Content slides can borrow the three-tone block logic for diagrams, with each layer of a process as one platform. Data slides become tidy stacks and stepped bars, where height shows quantity and the coral accent highlights the one number to remember.
For web interfaces, the style suits product homepages, feature pages, onboarding screens and pricing pages for software and developer tools. Primary actions take the violet, secondary surfaces use the blues, and the coral appears once on a status or badge. A dashboard in this mode should keep illustration to empty states and headers, letting the working surfaces remain flat and readable.
For editorial and marketing work, it fits explainer articles, white papers, launch posts and email headers that need to make an invisible product visible. Keep each scene to one message and give it generous empty space. Use the diagonal gradient band as a recurring structural device, so that several pages in a campaign feel like parts of the same system.
Common mistakes include breaking the grid angle, which makes scenes look sloppy, and overcrowding a platform with too many props until the structure disappears. Another is mixing in photographs or inconsistent illustration styles. Finally, remember that the style is now strongly associated with a specific era, so if you want to feel new, introduce a distinctive palette twist or a unique object rather than relying on generic servers and phones.

Isometric Illustration — FAQ
What is isometric illustration?
It is a drawing method that shows three-dimensional objects from a fixed angle without perspective, so parallel edges stay parallel and objects keep the same scale wherever they sit. In design it usually means chunky blocks, platforms and tiny figures drawn on a thirty-degree grid to explain software and systems.
Why was it so common on SaaS and crypto sites?
Because those products are invisible. Isometric scenes can turn abstract ideas like data pipelines or payment layers into tidy, friendly diagrams, they are easy to produce in volume and they scale across many pages. The trend was reinforced by gradient revival and by a popular shade of violet in 2018.
Is it the same as Corporate Memphis?
They are related but different. Corporate Memphis is a flat, friendly style of stylised human figures. Isometric illustration is a structural method built on a grid and block forms. They often appeared together, for example with small flat figures standing on isometric platforms, but you can use either alone.
Does it still feel modern?
As a generic formula it now reads as dated, because so many sites used it. The method itself remains an effective way to explain layered systems, so the way to keep it fresh is to use a restrained palette, original objects and plenty of white space rather than the stock servers and phones of the late 2010s.
What are the most important rules to keep?
Keep the thirty-degree angle everywhere, shade every block with three consistent tones, use violet for actions and a single warm accent for emphasis, and keep motion slow and gentle. If you hold those four rules, the rest of the system, type, spacing and layout, will fall into place around them.
Related design styles
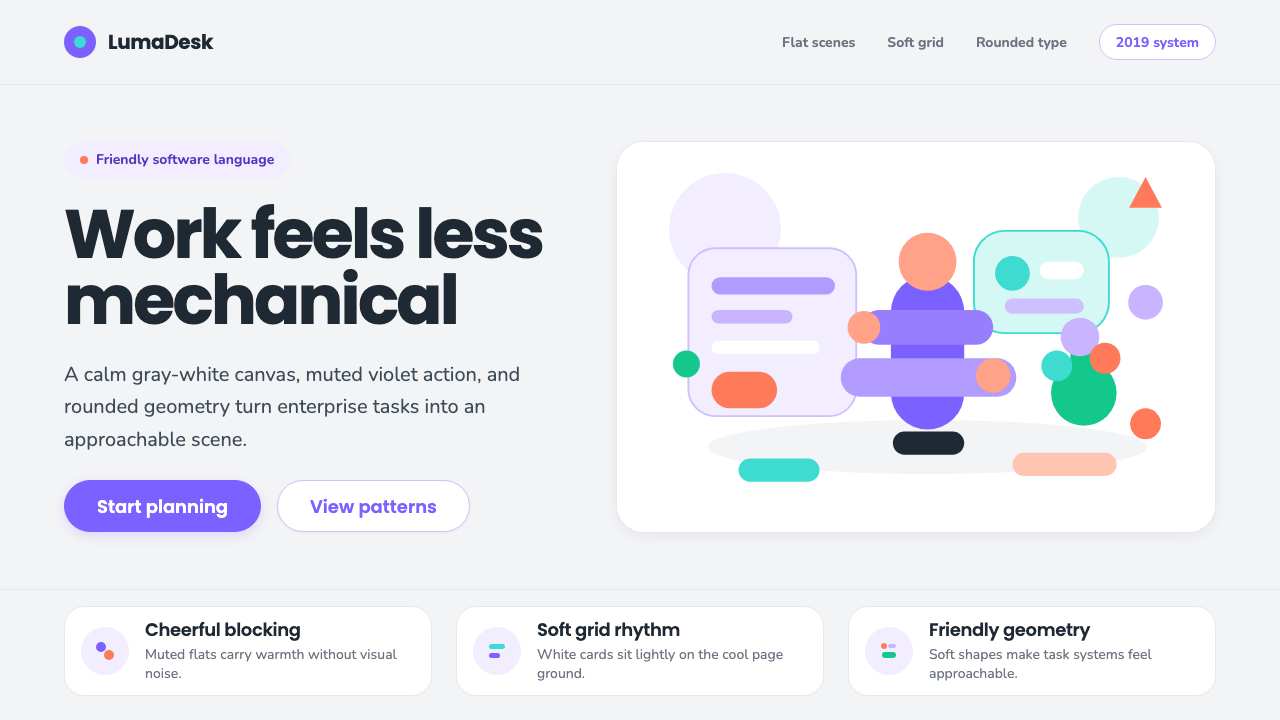 Corporate Memphis (Alegria)Friendly by design. Violet flats and rubber-hose geometry soften the SaaS gri…
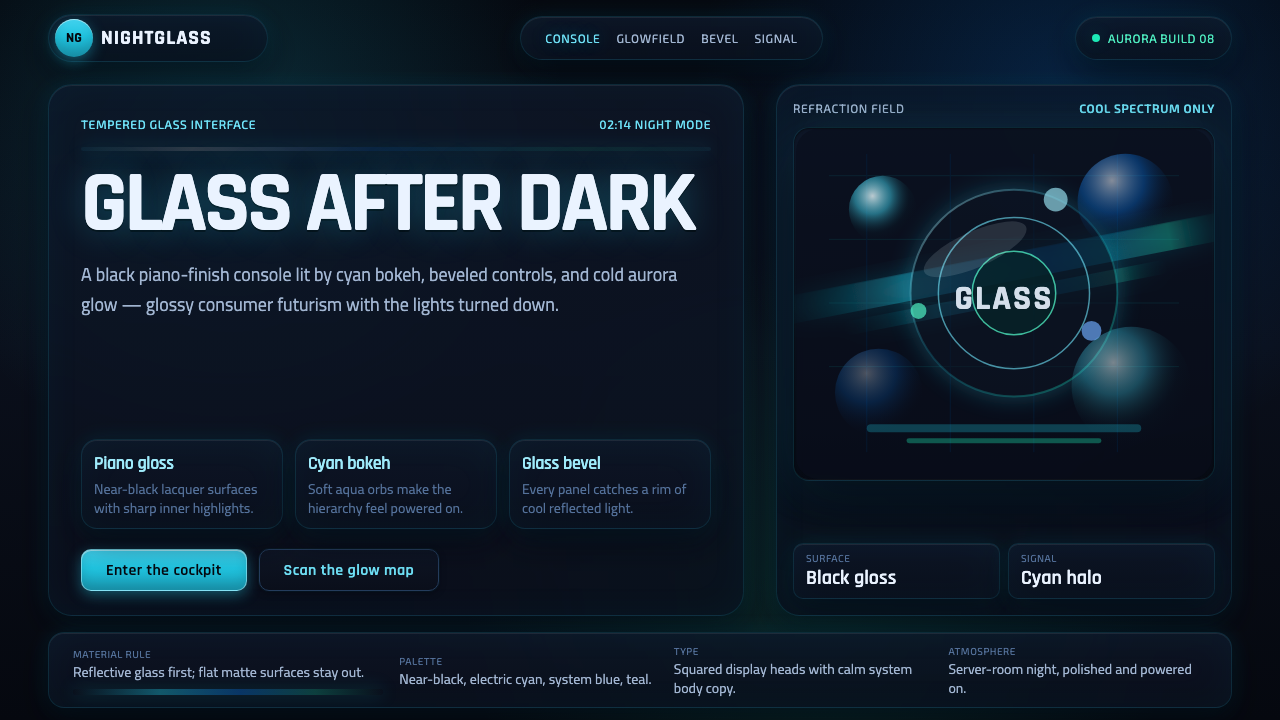 Dark AeroGlass glows after dark. Black lacquer, cyan bokeh, and beveled panels turn Ae…
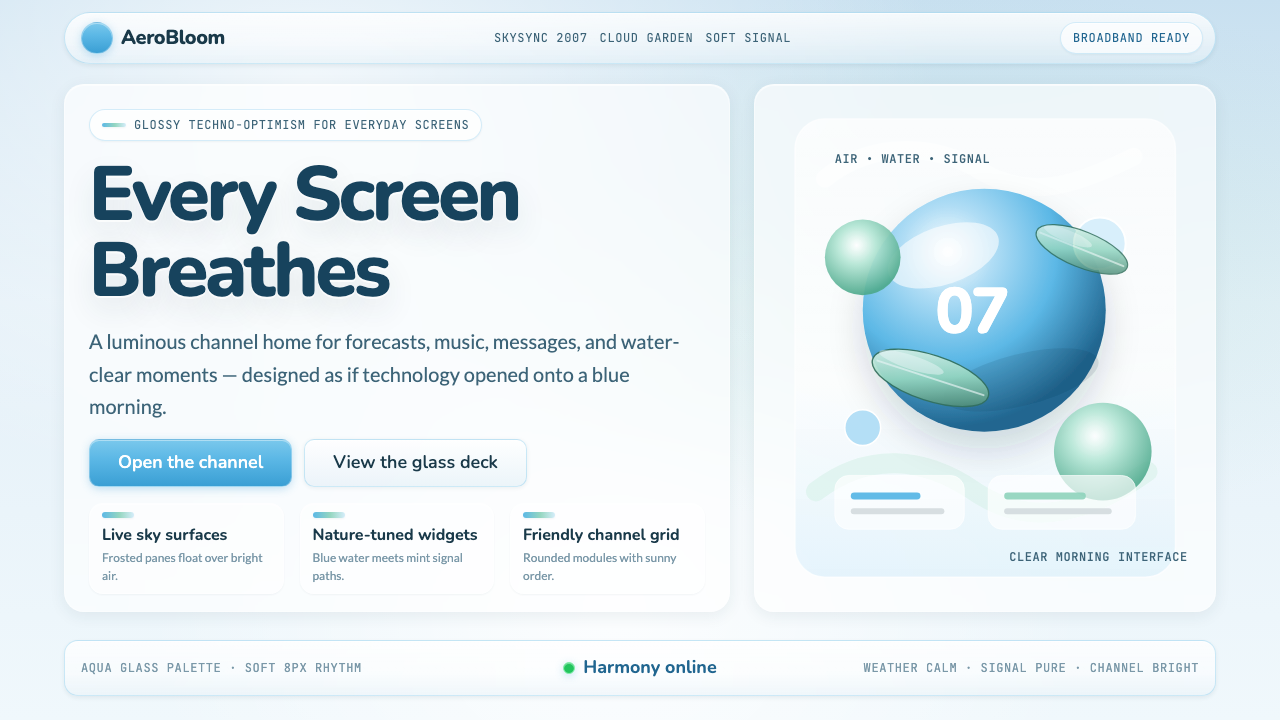 Frutiger Aero 2007Glossy techno-optimism. Translucent glass, photoreal skies, blue-greens — tec…
 Ubuntu Linux BrandLinux that feels human. Aubergine ground, one focal orange circle-of-friends,…
 Circular FintechFinance feels light. Lilac-white space, rounded cards, and one vivid purple g…
 Dropbox ModernFriendly SaaS gets loud. Electric blue and Sharp Sans drive a structured geom…