What is Home Energy Hub?
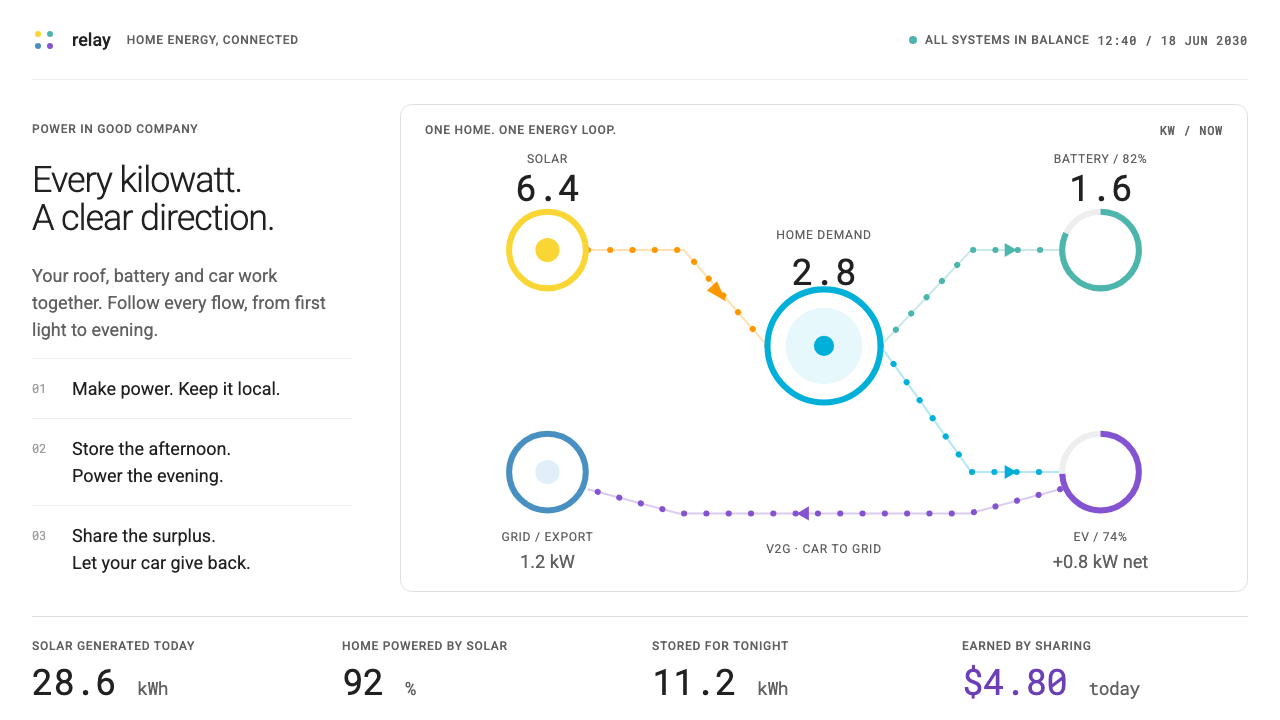
Home Energy Hub is a quiet white screen where every kilowatt has a colour and a direction, imagined for a household that trades power with its car, its battery and the grid.
Home Energy Hub in brief
Home Energy Hub is a speculative design language for the screen a household might check in 2030, when rooftop solar, a wall battery and an electric car all exchange power with the house and with the grid. It is deliberately an app rather than a brochure: a live flow diagram at the centre, a row of white cards beneath it, and a stacked bar chart that summarises the day.
Its visual vocabulary comes from software people already use. The Enphase Enlighten status screen, the mySolarEdge sun and the Home Assistant Energy dashboard all show energy as nodes joined by moving lines, and this system keeps that grammar and, above all, their colour code: solar in yellow and orange, battery in teal, grid in blue, and power sent back out in violet.
The result is an interface that tells an environmental story without the usual leaves and globes. White ground, round nodes, arcs carrying tiny moving dots and tidy cards do the persuading. Numbers are set in a monospaced face and keep changing, so the screen feels calm at rest and alive in its readings.

Where does Home Energy Hub come from?
This style is explicitly speculative: its era is set in 2030, but it is grounded in real products that already exist. The oldest reference is the Enphase Enlighten monitoring app, which spread through the 2010s as residential solar became common and homeowners wanted to see, in plain terms, what their panels were doing. Its status screen turned an invisible flow of electricity into a small diagram that a non-engineer could read at a glance.
The second reference is mySolarEdge, from 2019, which put a sun-and-flow picture at the heart of a mobile app and made the household's own generation the hero of the screen. The third is the Home Assistant Energy dashboard from 2021, created inside an open-source home automation community whose lead figure is credited in the sources as Paulus Schoutsen. Home Assistant made it ordinary for people to assemble their own energy view from whatever meters and devices they owned, and it established the habit of colour-coding sources and consumers in a consistent way.
The fourth reference looks forward to the car. Tesla Powershare, from 2024, belongs to the world of vehicle-to-home and vehicle-to-grid, in which an electric car is no longer only a load on the grid but also a battery that can send power back to the house or outward to the network. Alongside residential solar and storage, this idea of two-way power is the central premise of the system; a home becomes a small trading node rather than a passive customer.
The sources also name Badri Kothandaraman, associated with the solar and storage industry that Enphase belongs to, among the key figures. The movements behind the look are residential solar and storage, vehicle-to-grid and vehicle-to-home, and open-source home automation. Taken together, they explain the visual logic: a utility-grade subject, rendered with the friendliness of consumer software, and extended a few years into a future where the arrows on the screen point both ways.
What defines the Home Energy Hub look?
Live energy flow diagram
The centrepiece is a diagram of round nodes for solar, battery, car, house and grid, joined by arcs along which small dots travel. The direction of the dots tells you where power is going right now. The diagram replaces decorative illustration as the main picture of the product.
A fixed colour code for sources
Solar is yellow and orange, battery teal, grid blue and exported power violet. The code is inherited from real energy apps, so users who know one of them read the new screen instantly. The colours always mean the same thing, in diagrams, bars, badges and legends alike.
Quiet white ground
The page itself is white and neutral, so the colour-coded flows are the only loud thing on screen. Surfaces are clean cards with light separation, and decoration is kept to a minimum. This is what makes the data legible: colour is information, not ornament.
Monospaced readings that keep moving
Live power, tariff peaks and timestamps are set in a monospaced face. Digits keep a fixed width, so a changing number does not jitter the layout, and the readings feel like instrument output. The text around them stays in a plain sans-serif.
Cards in a tidy row
Beneath the diagram sits a row of white cards, one for each device or summary figure: battery level, car charge, today's production, grid import. Each card holds a single number and a short label. The row scans quickly and collapses gracefully on narrow screens.
Stacked bar of the day
A stacked bar chart shows where the day's energy came from and went, using the same colour code as the diagram. Because each source keeps its colour from the flow view to the history view, users never have to relearn a legend. The chart is flat, with no gradients or shadows.
Two-way arrows
Unlike older energy screens where power only flowed from grid to home, here every connection can reverse. The car can feed the house, the house can feed the grid, and the interface shows both directions with the same visual weight. Export is treated as a normal state, not an exception.

Who shaped Home Energy Hub?
Credited in the sources with the open-source Home Assistant project, whose Energy dashboard from 2021 popularised a consistent colour-coded view of home energy.
Named among the key figures of the residential solar and storage industry that produced apps such as Enphase Enlighten.
The 2010s monitoring app whose status screen turned residential solar output into a diagram ordinary homeowners could read.
A 2024 vehicle-to-home and vehicle-to-grid feature, the reference for treating the electric car as a battery that can send power back.
How do you use Home Energy Hub today?
On slides, Home Energy Hub suits energy, climate-tech and smart-home decks. A cover can be a white slide with a single large flow diagram and a monospaced headline figure. Content slides should lead with one diagram or one number, never a wall of bullets. Keep the colour code identical from slide to slide so the audience learns it once and reads every later chart without a legend.
For data slides, use the stacked bar and the card row as the two standard forms. A stacked bar shows a day or a month split by source; a row of cards gives three or four headline readings such as production, consumption, stored energy and exported energy. Label bars directly, set numbers in the monospaced face, and keep gridlines quiet so the colours carry the meaning.
On the web and in apps, the system fits energy dashboards, utility customer portals, solar installer tools, electric vehicle charging apps and home automation panels. The live diagram belongs at the top of the main screen, cards beneath it, and history in a separate tab. Controls such as charge limits or export schedules should be simple toggles and sliders in the same flat white language, with the active state shown in the colour of the source they affect.
In editorial and marketing work, the look is good for explainers about solar, batteries and vehicle-to-grid, and for brand pages of companies in the sector. Animated flow lines can illustrate a sentence as well as a paragraph of text. Copy should be factual and specific, with real units and real readings, since the style gets its credibility from looking like the tools people already trust.
The common mistake is to decorate. Adding leaves, globes, gradients or a green-washed palette undoes the main idea, which is that the data does the persuading. Another mistake is to reuse the colours casually: if yellow means solar on one screen and a warning on the next, the code collapses. Finally, avoid proportional fonts for live readings; digits that change width make the whole screen shake.

Home Energy Hub — FAQ
What is the Home Energy Hub style?
It is a speculative 2030 interface language for homes with solar, a battery and an electric car. It uses a white ground, a live flow diagram, white cards, a stacked bar of the day and monospaced readings, with a colour code that separates solar, battery, grid and export.
Which real products inspired it?
The Enphase Enlighten status screen, mySolarEdge from 2019, the Home Assistant Energy dashboard from 2021 and Tesla Powershare from 2024. The first three supply the diagram grammar and colour code; the last supplies the idea of a car that sends power back.
Why does the style use a monospaced face for numbers?
Live readings change constantly. In a monospaced face every digit has the same width, so the layout does not jitter as values update, and the numbers read like instrument output.
Does it work for something other than energy?
Yes, for any product whose core is a system of flows between nodes: logistics, finance, network monitoring or fleet tools. The colour-by-source habit and the quiet white ground carry over; just define a new colour code and apply it consistently.
Is the 2030 setting real?
No. The date is speculative, an imagined near future. The style is grounded in real products from the 2010s and 2020s, which is why it feels familiar rather than futuristic.
Related design styles
 AI Memory ArchiveRecall without spectacle. Quiet Noto Sans, cool Mica panes and a lavender tim…
 Astro Islands Architecture 2022Warm cosmic devtools. Deep violet, magenta glow, Inter clarity, and island ge…
 Bluesky AT Protocol 2024Open tech feels warm. Pale sky, cloud cards, Inter, and one cobalt accent car…
 Mistral Le Chat French AIOpen science feels engineered. Navy panels, Inter grids, and coral stripes ke…
 NeumorphismSoft plastic, moulded by light. Blue-grey plane, paired shadows, one red dot…
 shadcn/uiQuiet enough to disappear. White pages, zinc hairlines, one near-black button…