What is ECG Strip Paper?
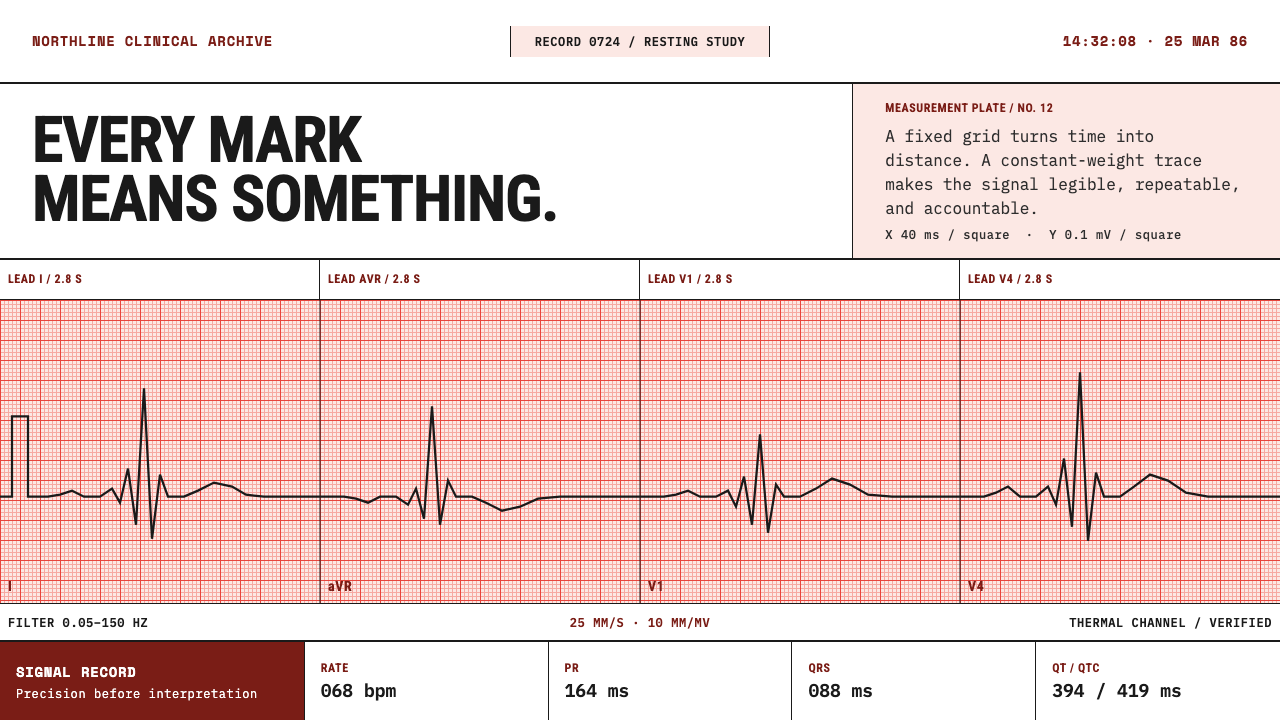
ECG strip paper is a measuring instrument disguised as a sheet of paper: a dense salmon-red grid, one unwavering burned line, and nothing floating above the surface.
ECG Strip Paper in brief
ECG Strip Paper is a light design style drawn from the thermal chart paper that hospitals use to record the electrical activity of the heart. White stock is overprinted with a fine millimetre grid, so dense that the whole sheet reads as pale salmon rather than white. On it, a near-black trace of constant weight is burned in by a heated stylus, accompanied by calibration marks, lead labels and a footer line. It is a light style, but not a soft one. This paper was never designed to be looked at. It was designed to be measured.
The look is easy to recognise and hard to fake. A salmon-red field carries a fine grid, with heavier lines falling at regular intervals so the eye can count without effort. The trace is a single line that never thickens, tapers or pools like ink. Lettering is small, plain and functional, identifying leads and settings rather than decorating the page. At the foot of the sheet a line states the paper speed and the gain, because without them a recording cannot be read.
The governing principle is that the grid is the surface, and nothing floats above it. There are no cards lifted off the page by shadow, no rounded containers, no panels with their own backgrounds. Every element sits on the grid the way a mark sits on graph paper, and every mark means something: a position in time, a magnitude in voltage, a label that tells the reader what they are looking at. The style is austere because it is precise, not because it is minimal for its own sake.
Where does ECG Strip Paper come from?
Electrocardiography records the minute voltage changes that the beating heart produces at the skin. Its founding figure is Willem Einthoven, whose string galvanometer made the signal measurable and whose arrangement of limb leads is still called by his name. Early recordings were made photographically, but the key insight survived every change of technology: a trace is only meaningful against a calibrated reference. A reader needs to know how much time lies between two peaks and how large a deflection is, so a printed grid became inseparable from the trace itself.
The vocabulary of the modern recording was assembled over the following decades. Emanuel Goldberger contributed the augmented limb leads, and Frank Wilson contributed the central reference and the chest leads, so that the standard twelve-lead recording came to show the heart from twelve electrical viewpoints. The style belongs to the period from 1950 to 1990, the era of the strip-chart recorder and the twelve-lead cabinet, when a machine on a cart printed the leads in blocks across a wide sheet with a long rhythm strip running along the bottom.
The third ingredient is the thermal printing technology that gives the sheet its character. There is no ink and no pen. A heated stylus passes over a coated paper and darkens the coating where it touches, so the line has the same weight from start to finish and cannot smudge, taper or run dry. This is the origin of the style's insistence on a constant-weight trace. The stock is still a current hospital consumable, which is unusual for a design reference: the object that inspired the style is not a relic, and it sits on carts and in drawers today.
The grid is printed in red for a working reason, not an aesthetic one. Under a scanner that reads only the red channel the red grid drops out while the black trace survives, so recordings can be digitised and the line picked out cleanly. The sheet has no single country of origin; it is a global hospital standard whose conventions are shared wherever hearts are recorded. The style belongs to the family of clinical instrumentation graphics, strip-chart recording and thermal-print consumables, and it inherits their discipline: the grid is the surface and nothing floats above it.
What defines the ECG Strip Paper look?
Salmon grid ground
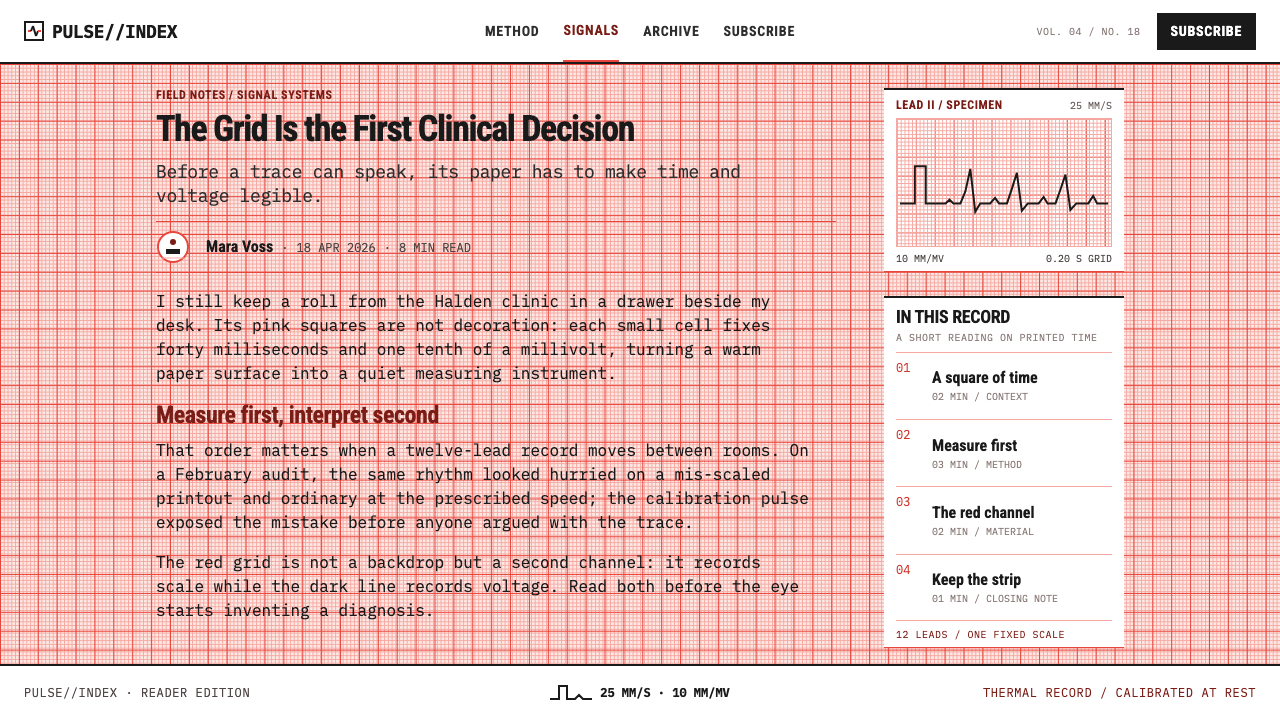
The ground is white stock covered by a fine red grid so dense that the sheet reads as a pale salmon tint. At regular intervals a heavier line groups the small squares into larger blocks, which lets a reader count at a glance. The tint is warm and a little clinical at once. It is never used as wallpaper behind other things; it is the page itself, and every other element is placed against its squares.
The constant-weight line
The trace is a near-black line of one weight from beginning to end, with no taper, no ink pooling and no pressure variation. That follows directly from the heated stylus, which leaves the same mark wherever it touches. In the style, every line that carries data is drawn this way. Variations in importance are expressed by position and labelling, never by thickening the line.
Calibration pulse
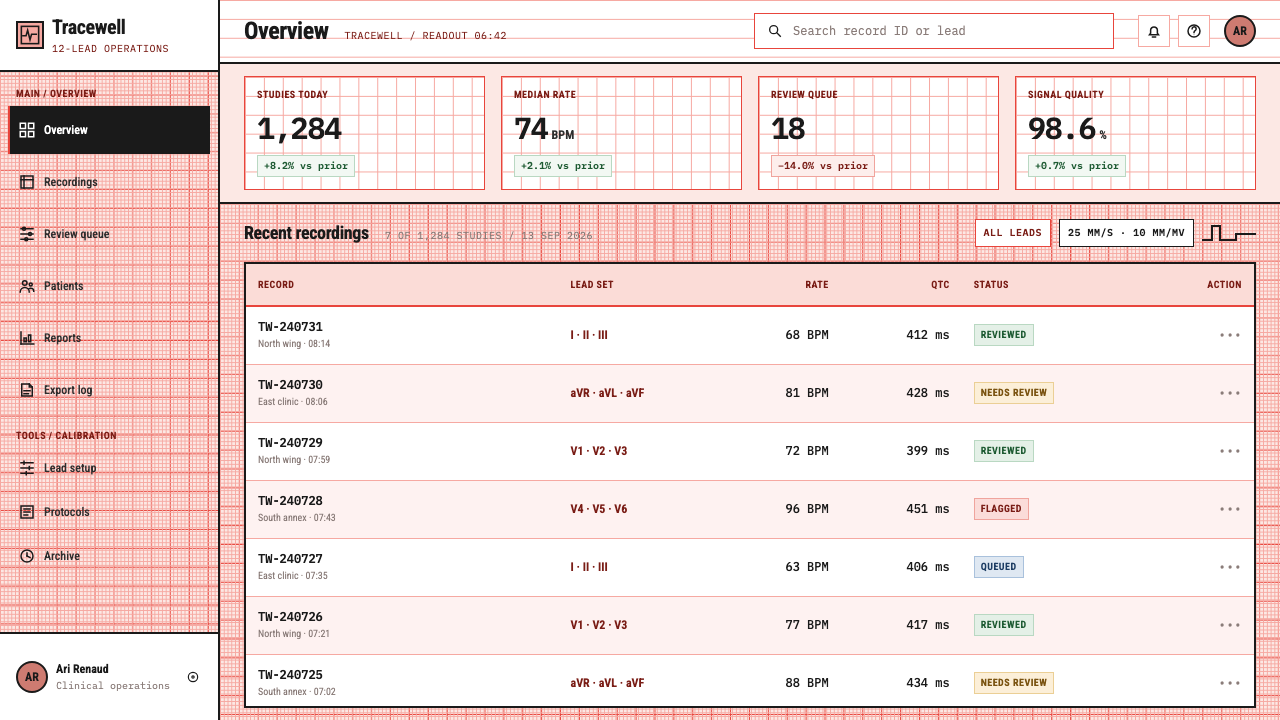
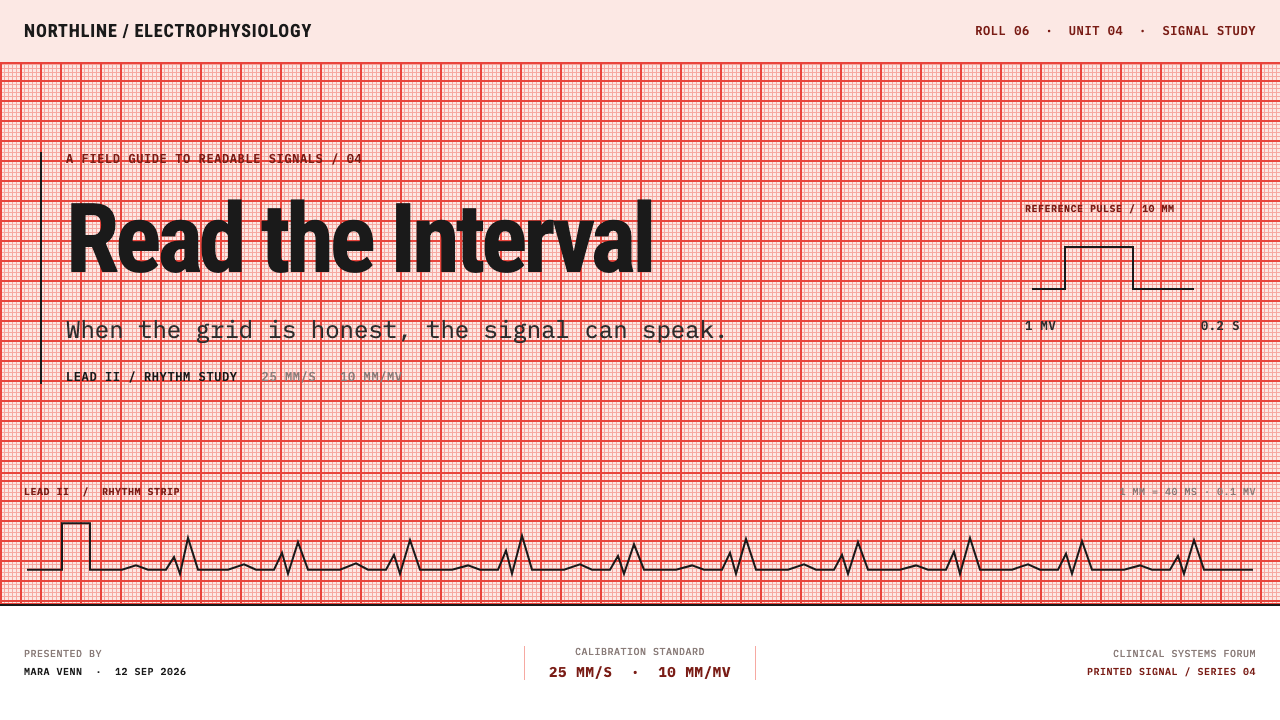
At the start of each lead line sits a small square-shouldered pulse, the calibration mark that fixes the scale of everything that follows. It is the sheet's way of stating its units. In the style it becomes a recurring signature: a square step at the left of a trace tells the reader that this chart knows what its numbers mean, and that the scale is part of the content.
The declared footer
A single line at the foot of the sheet states the paper speed and the gain. Without it, a recording cannot be interpreted, so the line is as essential as the trace. The style treats the footer as a rule of honesty: every chart declares its scale, small and plain, in the same place every time. A page that skips the declaration is not a faithful version of the style.
Instrument lettering
Type is small, plain and functional, set in the neutral lettering of equipment labels. It names leads, patient fields and settings, and it never competes with the trace for attention. Headlines in the conventional sense barely exist. When emphasis is needed it comes from placement on the grid and from capitalised labels, not from size contrasts that would break the sheet's even, technical voice.
Flat, shadowless, rectangular
There is no depth on a chart strip. No shadows lift elements off the page, no gradients suggest light, and nothing is rounded for friendliness. Blocks are rectangles that align to the grid, and the whole composition reads like a form that has been filled in. This flatness is what keeps the sheet honest: if nothing floats, then nothing can hide, and every mark can be traced back to a measurement.
Who shaped ECG Strip Paper?
Einthoven is the founding figure of electrocardiography. His string galvanometer made the heart's electrical signal recordable with precision, and the arrangement of limb leads he established still carries his name. His lasting contribution to this style is the idea that a trace and its scale are one object: a recording without a calibrated reference is not a measurement, which is why the grid and the line have never been separated.
Goldberger is associated with the augmented limb leads, which amplify the signals from the limbs so that the heart can be viewed from additional angles on the same sheet. The extra leads are part of why a twelve-lead page became a dense, labelled grid of parallel traces. For the style he stands for the idea that more information is added by more labelled, aligned lines, not by more ornament.
Wilson is associated with the central reference point and the chest leads, which let the heart be seen from the front of the body in a series of positions. His work completed the twelve-lead layout that the strip-chart and cabinet era printed in blocks. In the style he stands for the page as a system: a sheet whose parts are standardised so that a reader anywhere can find the same lead in the same place.
How do you use ECG Strip Paper today?
ECG Strip Paper transfers best to subjects in which numbers are the story and the reader is expected to read values, not just feel them: health technology, laboratory tools, monitoring and observability products, engineering reports, science education and any brand that wants to present itself as measured and exact. The style rewards honesty about scale. If a design cannot say what its units are, it should not borrow this look.
On slides, a cover can run a full-bleed grid with one trace crossing the width of the slide and a plain title lettered low on the left, like a recording with its patient field. Content slides keep the grid as the page and align text blocks to its squares, with no panels. Data slides are the style's natural ground: line charts are literally traces, drawn at constant weight on the grid, with units declared in a footer line and a small square pulse at the start of each series.
In web interfaces, the style suits monitoring dashboards, time-series tools, clinical and lab software, and developer products that show live signals. Let the page grid carry the layout, place metrics as labelled readouts rather than lifted cards, and use rules and alignment instead of shadows. Pricing tables work as filled-in forms: tiers in rows, values aligned to the grid, the scale stated once. Keep interactive states quiet; the hover effect that suits this style is a darker line, not a glow.
For editorial and marketing work, the sheet is a strong visual anchor for reports, white papers, medical education and technical explainers. A page can open with a trace running across the top, use the grid as a hairline background for sections, and treat captions like footer lines that declare what is being shown. Campaigns do well when they promise precision and then demonstrate it with figures that carry their units.
The most common mistake is treating the salmon grid as decorative wallpaper behind soft, shadowed cards, which destroys the central rule that nothing floats above the surface. A second mistake is varying line weight to add drama; a heated stylus cannot do that, and the style loses its credibility when it does. A third is pushing the red so strongly that text becomes hard to read. The grid should sit back like a scale, and the trace and labels should always win.
ECG Strip Paper — FAQ
Is this just graph paper with a red tint?
No. Graph paper is a neutral drawing aid, while ECG paper is bound to a specific measuring system. The grid has fixed meaning: horizontal distance stands for time and vertical distance for voltage, and the sheet always declares its paper speed and gain in a footer. The trace is burned by a heated stylus, so its weight never changes. The style keeps those obligations, which is what separates it from a decorative grid pattern.
Why is the grid red rather than grey or blue?
It is a working choice. Under a scanner that reads only the red channel, a red grid drops out of the image while the black trace remains, which makes recordings easy to digitise and the line easy to extract. The warm tint is also a pleasant byproduct: the dense grid turns the sheet pale salmon. In the style, the red is functional first, so it should not be recoloured to match a brand without understanding what that choice gives up.
Can the style work outside healthcare?
Yes, wherever a product shows measured values over time: finance charts, energy monitoring, sports performance, climate data, developer observability. The style travels well because its values are about measurement and honesty, not about medicine. It becomes strained for subjects with no real data to display, since the grid and the trace then become a costume rather than a working surface.
How do I keep text readable over a dense grid?
Keep the grid light and let text and traces be clearly darker. Set body copy and labels in dark ink, align blocks to the grid, and avoid placing long paragraphs directly over the busiest areas. If a section needs extended reading, give it a plain white block aligned to the grid, which echoes the unprinted margin of a real sheet. The goal is for the grid to behave like a scale: present, readable and never loud.
Can ECG Strip Paper be adapted to a dark theme?
The style is defined by white thermal stock and a burned dark line, so its logic is light-ground. A dark version would be a different object, closer to a patient monitor screen than to a printed strip. If a dark variant is unavoidable, keep the principles rather than the palette: a single trace weight, a visible scale, a declared footer and an unlifted surface.
Related design styles
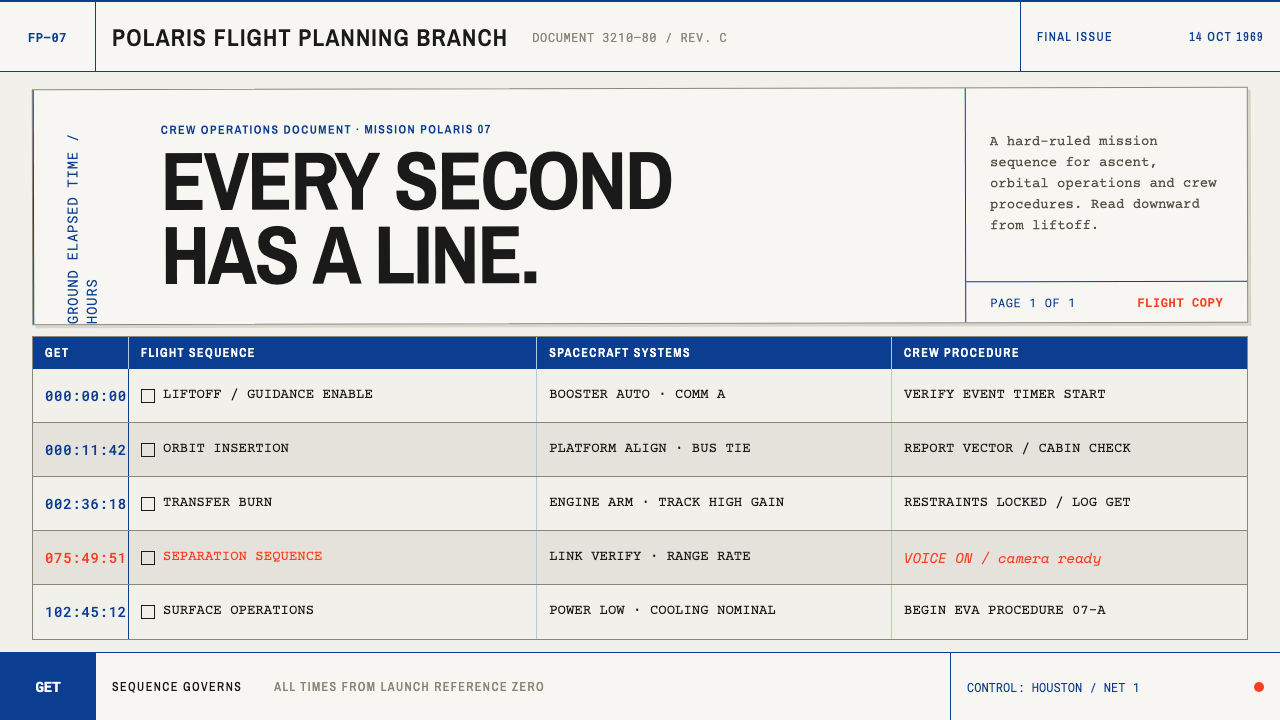 Apollo Flight PlanEvery second has a line. NASA blue rules and monospaced GET stamps discipline…
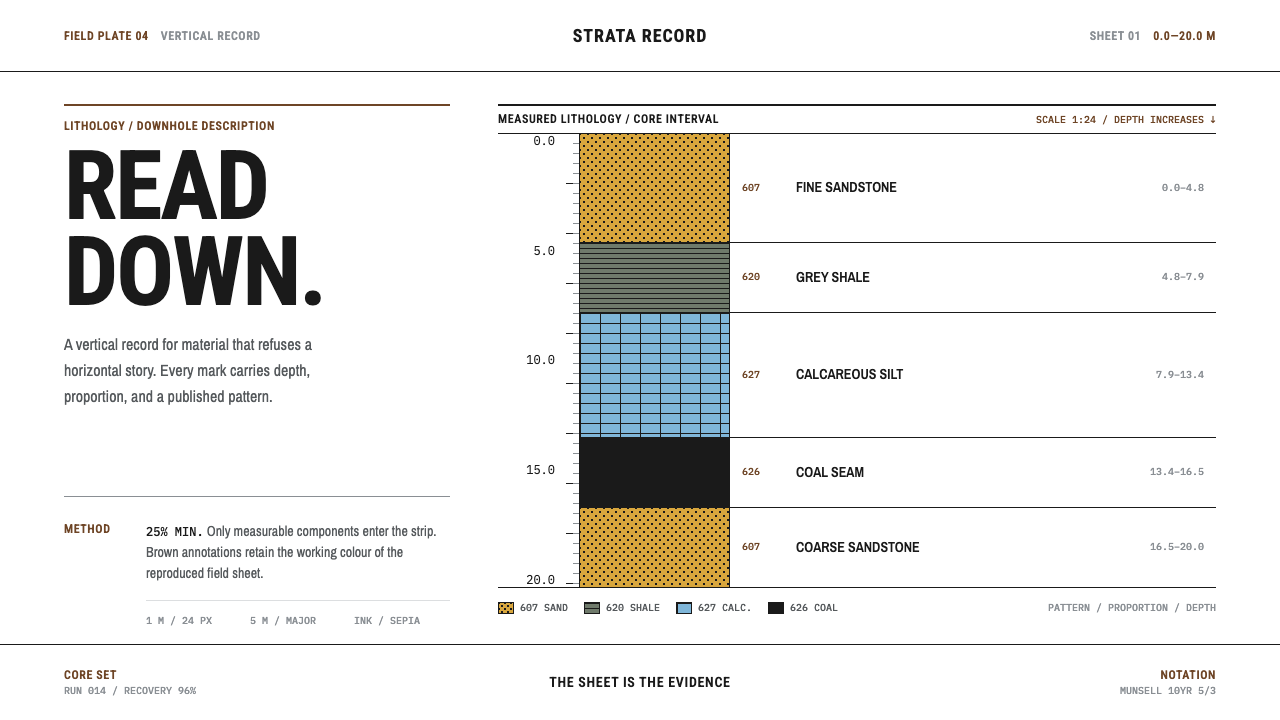 Core Sample LogRead the ground downward. Sepia rules and FGDC black patterns turn depth into…
 Doctor's Clinical Lab CoatSterile by design. Cool clinical white, teal signals, and seam-line grids enf…
 Frutiger CDG AirportLegibility at runway scale. Navy panels, white humanist sans, arrow-led grids.
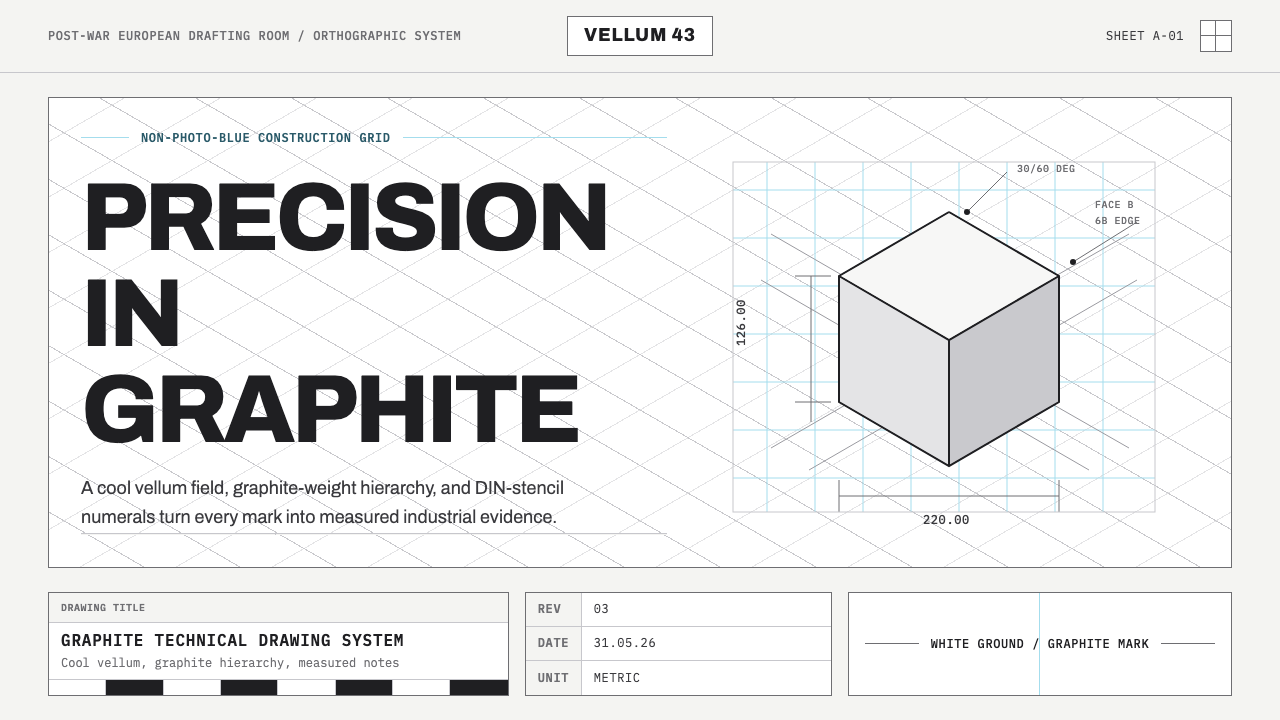 Graphite Technical DrawingDrafting-room precision. Non-photo-blue grid and graphite DIN lettering do th…
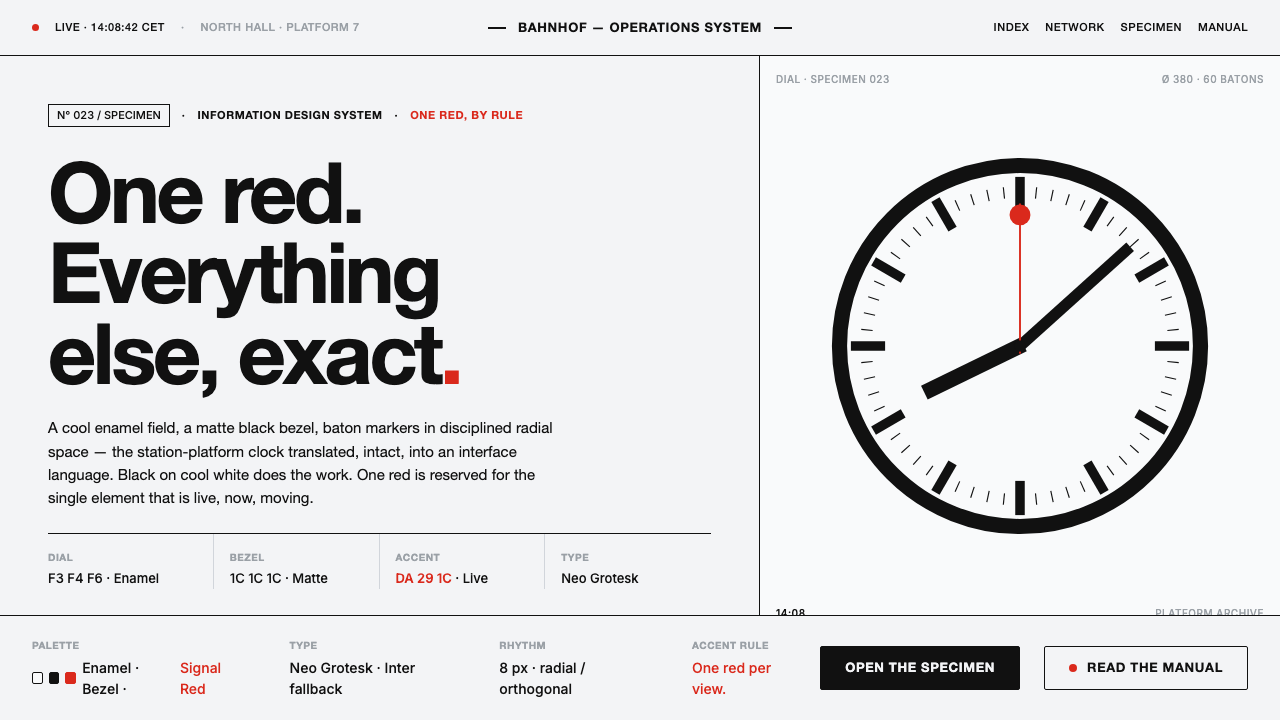 Hilfiker Railway ClockEverything exact, one thing live. Black hands on cool enamel white — one red…