What is Snow Crystal Classification?
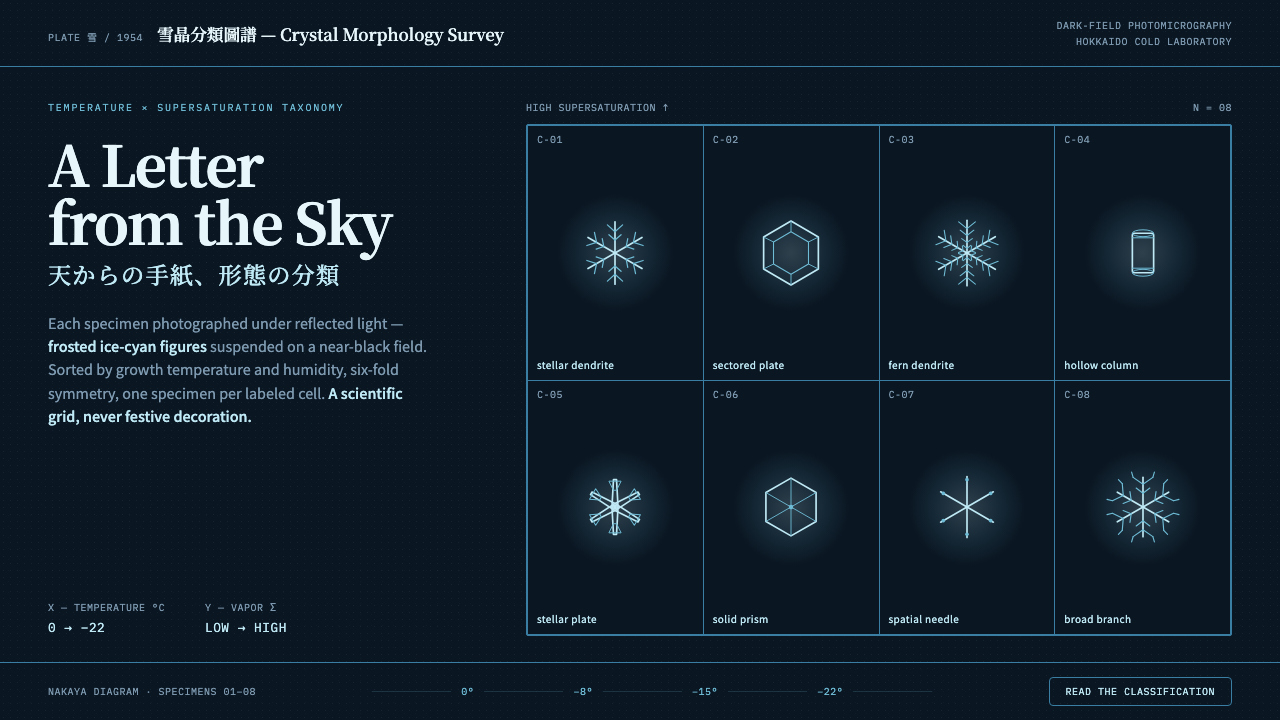
Snow becomes a scientific map: frosted ice-cyan crystals classified across a dark temperature-and-humidity grid.
Snow Crystal Classification in brief
Snow Crystal Classification translates Ukichiro Nakaya's 1954 morphology charts into a visual system built around taxonomy rather than decoration. Its subject is not winter atmosphere but the disciplined ordering of specimens: dendrites, plates, and columns positioned across a temperature-versus-humidity grid, each cell holding a distinct crystal form.
The visual field is near-black and cold, allowing reflected light to define every specimen. Crystals appear frosted white with a documented blue cast, producing an icy reading without relying on sparkle, seasonal ornament, or scenic imagery. The darkness is functional: it establishes the conditions for observation and makes each pale crystal behave like evidence.
This system is recognizable through its scientific constraints: labeled axes, rigorous cell divisions, six-fold hexagonal symmetry, and one specimen per cell. It should feel closer to a classification plate or laboratory chart than to a holiday graphic. The grid organizes attention, while the crystal remains the only object with visual irregularity.
Where does Snow Crystal Classification come from?
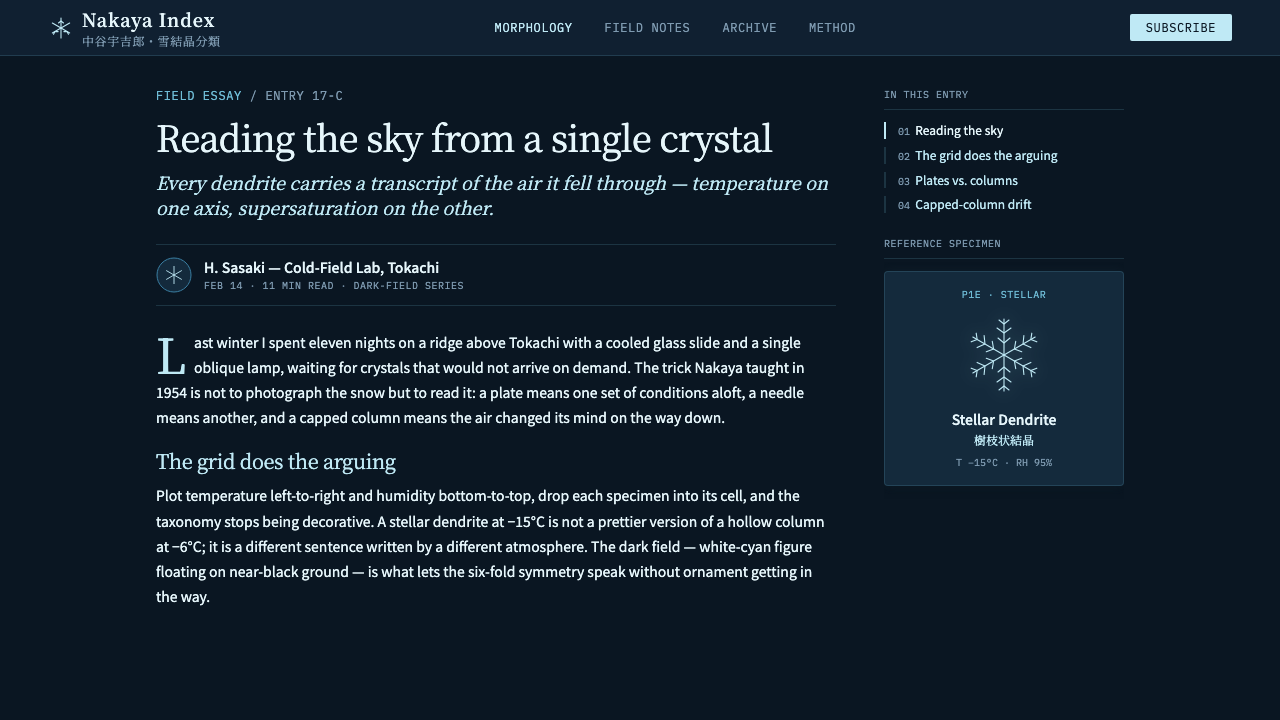
The system is rooted in East Asia, specifically Hokkaido, Japan, where Ukichiro Nakaya conducted his snow-crystal work in a low-temperature laboratory. The setting matters because the design language retains the character of controlled observation: specimens are not presented as a generic collection, but sorted according to labeled environmental coordinates.
Nakaya's morphology charts, associated with 1954 and Harvard University Press, provide the historical anchor. Their importance within this system is methodological. Snow is treated as a field of variation that can be recorded, compared, and arranged. The chart is therefore both an image archive and an ordering device, turning natural forms into a legible taxonomy.
The visual movement combines dark-field photomicrography with crystallographic and meteorological taxonomy. Dark-field illumination makes the crystal visible through reflected light against a deep field, while the taxonomic structure gives each image a defined position. Neither side is optional: without the dark field, the crystals lose their icy presence; without the grid, they become an unrelated gallery of images.
The broader reference era is 1950–1990, but the system remains centered on Nakaya's classification rather than expanding into a general history of snow photography. Its defining contrast is with Bentley's white-on-white plates. Where those plates make snow feel delicate and luminous, Snow Crystal Classification makes it analytical, cold, and spatially indexed.
What defines the Snow Crystal Classification look?
Dark Field
The ground is near-black, deep, and visually quiet. It is not a mood-setting backdrop but an observational field that gives reflected light somewhere to register. The darkness should remain continuous and cold, allowing every crystal to read as an isolated specimen.
Ice-Cyan Light
Crystals are frosted white with a restrained blue cast. The color belongs to the reading of ice and reflected light, not to decorative brightness. Pale cyan should distinguish specimens from the field while preserving their scientific, almost photographic character.
Taxonomic Grid
The grid is the primary organizing structure. Temperature and humidity function as labeled axes, and the cells create a visible field of comparison. Lines should feel measured and purposeful, never ornamental; their job is to explain relationships between specimens.
Hexagonal Symmetry
Snow crystals are defined by six-fold hexagonal symmetry. This recurring structure gives the system a formal rhythm even when individual dendrites become intricate. Symmetry should be treated as evidence of classification, while irregular branching remains a record of the specimen itself.
One Specimen per Cell
Each cell contains one principal specimen. This restraint prevents the chart from becoming a crowded collection and keeps every crystal legible as a classified example. Repetition belongs to the grid; singularity belongs to the image.
Scientific Contrast
The system depends on the contrast between a dark field, pale cyan specimens, and precise labels. It avoids theatrical glow, scenic winter imagery, and festive decoration. The effect is rigorous rather than romantic: the viewer is invited to inspect, compare, and locate.
Who shaped Snow Crystal Classification?
Nakaya is the central figure behind the system. His Hokkaido laboratory work and 1954 morphology charts provide the method: classify dendrites, plates, and columns across temperature and humidity rather than presenting snow as an undifferentiated visual motif.
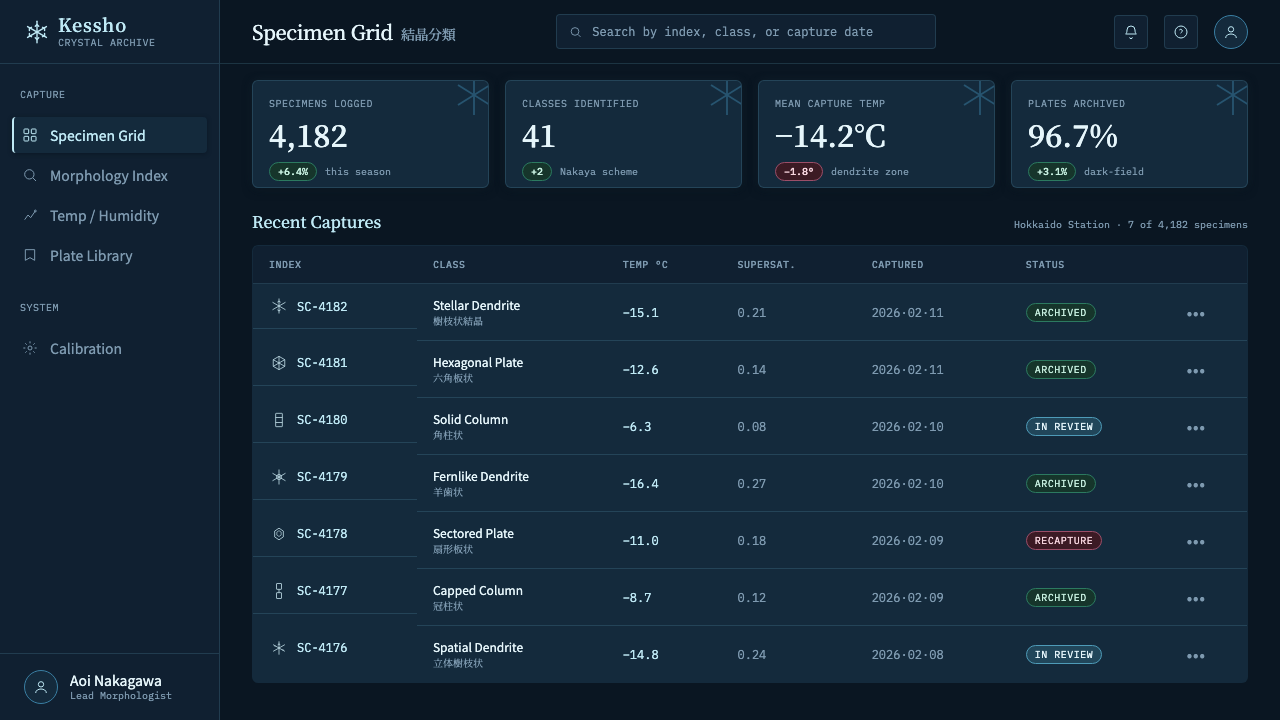
The grid is the system's main diagrammatic figure. Its axes turn a collection of crystal images into a field of relationships, making position and comparison as important as the individual specimen.
The crystal carries the visual identity: frosted, blue-cast, and organized by six-fold symmetry. Its branching or plated form supplies variation without breaking the system's underlying order.
Dark-field illumination is both a technique and a visual principle. It establishes the deep field against which reflected light reveals each specimen, giving the classification its cold, photographic presence.
How do you use Snow Crystal Classification today?
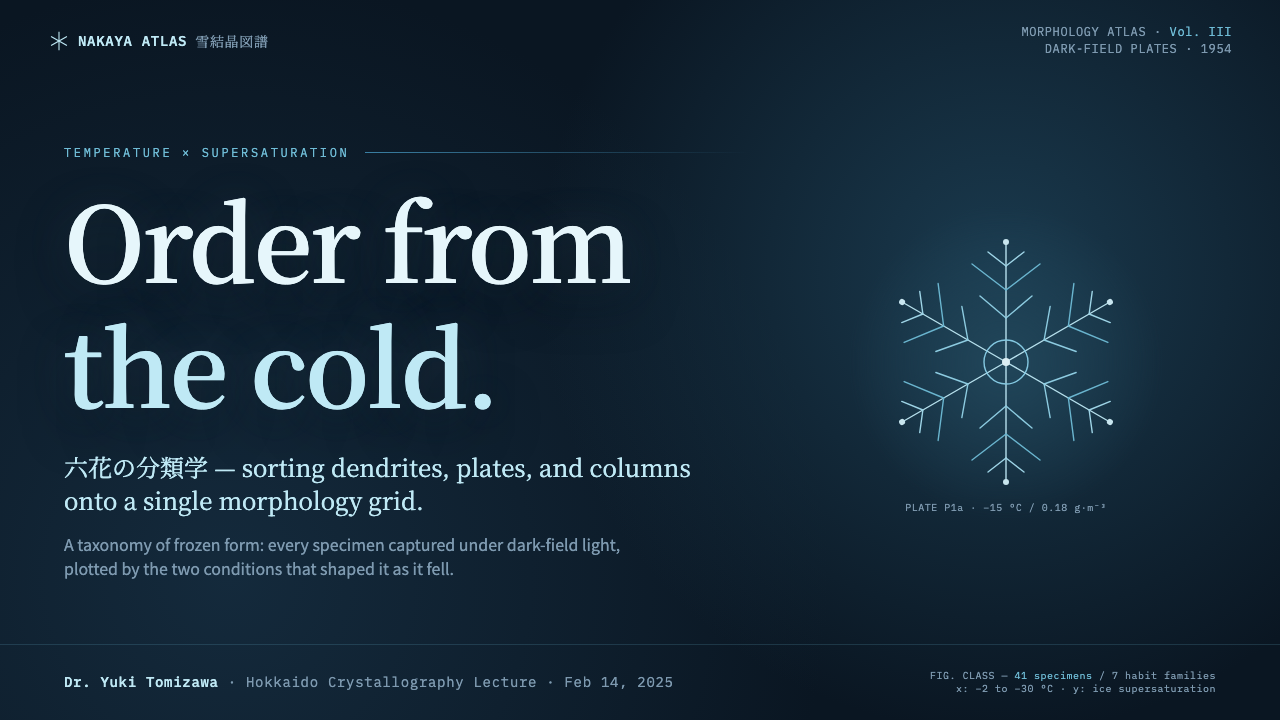
For presentation slides, use the dark field as a continuous analytical surface. Cover slides can feature a single enlarged crystal crossing or occupying one region of the grid, with the title treated like a chart label. Content slides should preserve the temperature-and-humidity logic: one clear organizing axis, restrained specimen placement, and labels that explain rather than decorate. Data slides work best when the chart itself resembles a classification plate, with pale cyan marks on the dark field and one specimen or category emphasized at a time.
For web interfaces, the system suits dashboards, observatories, catalogues, and pricing pages that need a sense of measured comparison. A dashboard can use grid cells as status or category compartments, with crystal-like forms reserved for meaningful states rather than background texture. A pricing page can present each tier as a classified specimen, using consistent labels and cold pale highlights to distinguish the active choice. Dark surfaces should remain calm so that information, not atmosphere, carries the hierarchy.
For editorial and marketing work, build the page like a field guide. Use a strong title, labeled coordinates, specimen captions, and generous dark intervals between sections. Product or campaign imagery can be isolated against the deep field and treated as evidence, while short annotations explain its category or position. Marketing language should emphasize discovery, structure, and precision; the visual system is most convincing when the promise feels documented rather than embellished.
The style also works for educational material because it makes classification visible. A lesson, archive, or museum page can introduce the grid first, then reveal the crystal forms as examples within it. The relationship between axis, cell, label, and specimen should remain understandable even when the viewer sees only a small portion of the composition.
The common mistake is using snow crystals as decorative wallpaper. Repeating many crystals without axes, labels, or meaningful cell placement turns the system into winter ornament and removes its defining logic. Another mistake is whitening the crystals until they lose their blue cast, or brightening the field until the dark-field contrast disappears. Keep the taxonomy primary, the specimen singular, and the cold reflected light restrained.
Snow Crystal Classification — FAQ
Is Snow Crystal Classification a winter decoration style?
No. Its subject is taxonomy. The crystals matter because they occupy classified positions within a temperature-and-humidity grid, not because they suggest a seasonal mood. Remove the axes, labels, and specimen logic and the style loses its identity.
How is it different from Bentley's snow-crystal plates?
Bentley's plates are associated with white crystals on white grounds. Snow Crystal Classification instead uses a near-black dark field and reflected ice-cyan light, then adds labeled axes and cell-based comparison. The result is colder, more analytical, and more explicitly taxonomic.
Can the system use many crystals at once?
It can show a field of specimens, but each crystal should retain a clear classified role. A dense accumulation without cell logic becomes texture. The grid should create comparison, while the individual crystal remains legible as evidence.
Why is the blue cast important?
The blue cast carries the icy reading described in the source material. It separates the specimens from plain white and keeps the system tied to reflected cold light. If the crystals become neutral white, the visual language moves closer to a generic scientific plate or Bentley's white-on-white treatment.
What makes the style feel scientific rather than atmospheric?
The scientific character comes from the complete relationship between field, axes, cells, labels, and specimens. Dark contrast alone creates atmosphere; classification turns that atmosphere into an instrument for reading and comparison.
Related design styles
 Feynman Diagram QEDMeaning reduced to strokes. Pale QED lines and TeX serif type float on blue-b…
 Modern Arabic Type SpecimenDry proof-sheet gravity. Black naskh grids on aged grey-beige, cut by red fol…
 Nakagin Capsule TowerArchitecture as cells. Cool gray modules, dark cores, and porthole circles lo…
 NYC Transit HelveticaOrder made visible. White type, black enamel, route discs, and a grid that ne…
 Tehran Bank ModernismLate-Pahlavi corporate cool. Slate concrete ground, one steel-blue rule, a La…
 Univers Frutiger Numbered GridDifference becomes a system. Numbered grey type locks to a dark grid, with on…