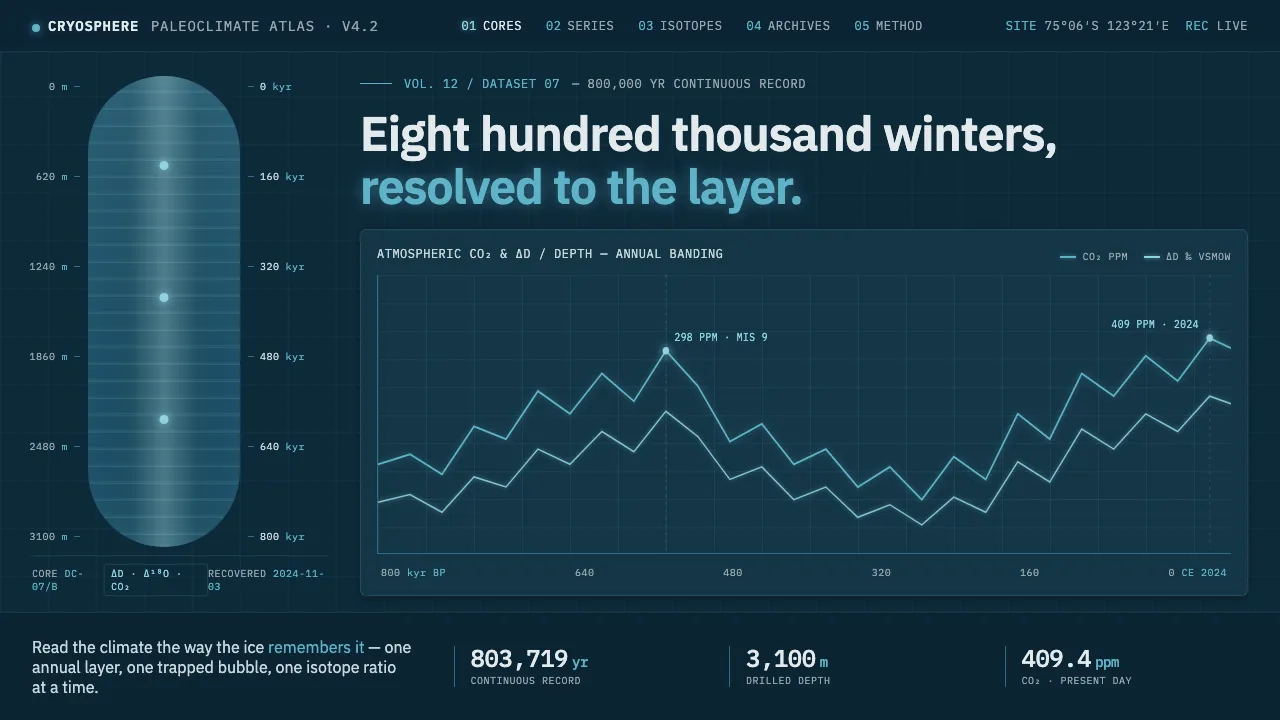
About Ice Core Climate Data
Ice Core Climate Data distills the visual language of paleoclimatology — the science of reading Earth's past climate from cylinders of ancient ice. Back-lit ice cores reveal banded annual layers; thin line plots trace deuterium and CO2 against depth and age. Thick, clean ice scatters red and reads cyan-blue, so the system glows cyan curves on a deep ice-blue field.
The result is a sparse, instrument-grade interface: monospaced year and depth labels, restrained gridlines, and translucent back-lit gradients that let the data — not decoration — carry the meaning.
- Origin
- Global / Antarctic & polar ice-core research
- Era
- 2010–now (contemporary ice-core paleoclimatology; Vostok / EPICA records)
- Key figures
- British Antarctic Survey · Vostok ice-core programme · EPICA consortium · CDIAC isotope datasets
- Movements
- Paleoclimate data visualization · Glaciology / blue-ice physics · Scientific charting · Monospaced data annotation
Ice Core Climate Data design spec
Colors
Typography
The other 11 sections — buttons, cards, spacing, motion, techniques and more — open once you unlock. Download the DESIGN.md or send it to your AI in one click. Unlock once, yours forever.
Sign up nowStyles similar to Ice Core Climate Data
Also inspired by science & nature, with a close feel.
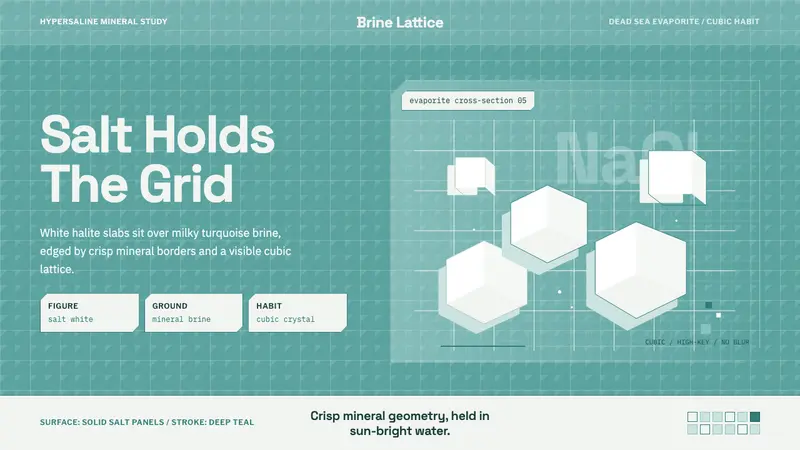 Salt Crystal EvaporiteCrystalline and cold. Salt-white cubes float over turquoise brine in a hard lattice.
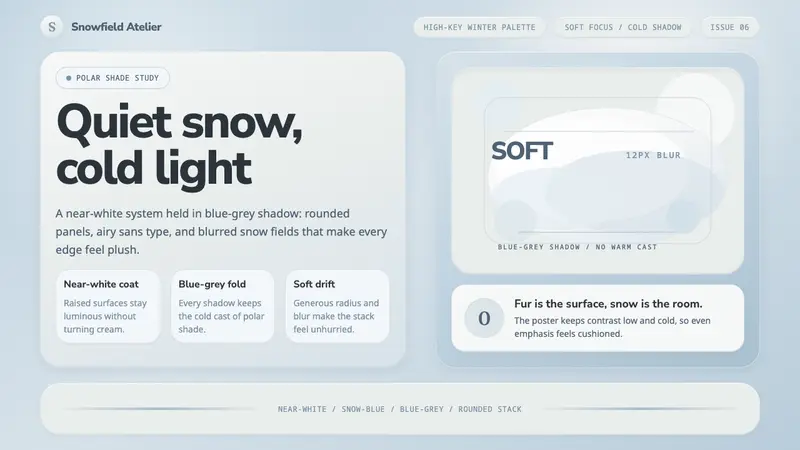 Arctic Fox Winter CoatIcy softness, never cream. Near-white panels float over snow-blue shadow.
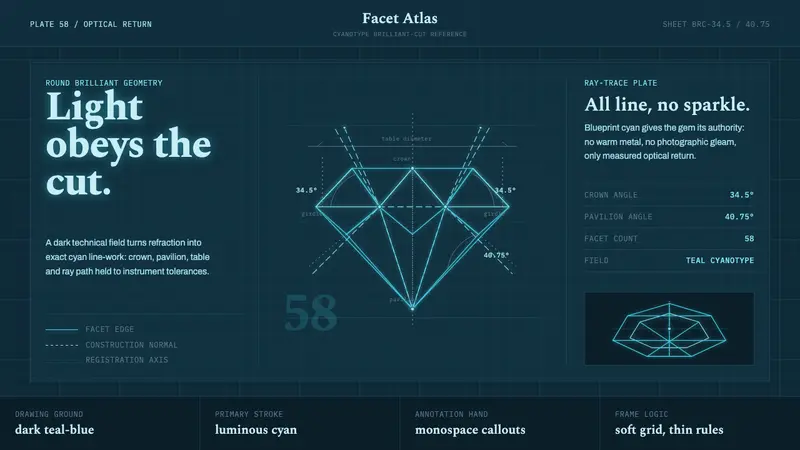 Brilliant Cut Facet DiagramOptics becomes blueprint. Cyan facet lines and ray paths glow on dark teal.
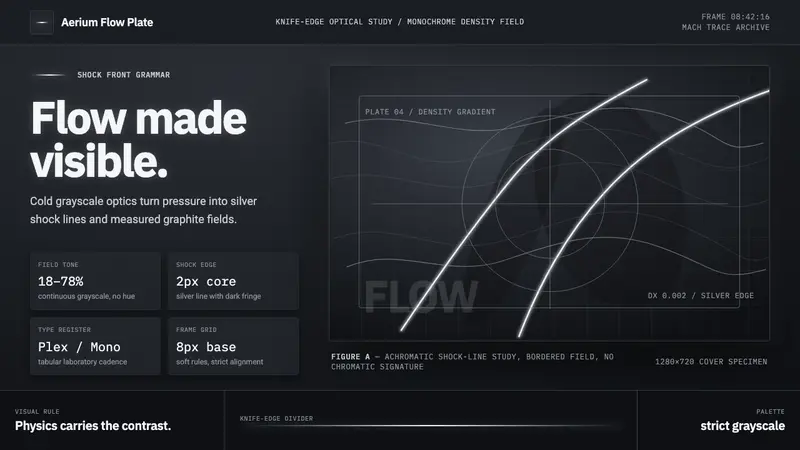 Schlieren ShadowgraphInvisible air becomes silver. Cool grayscale fields cut by precise shock lines.