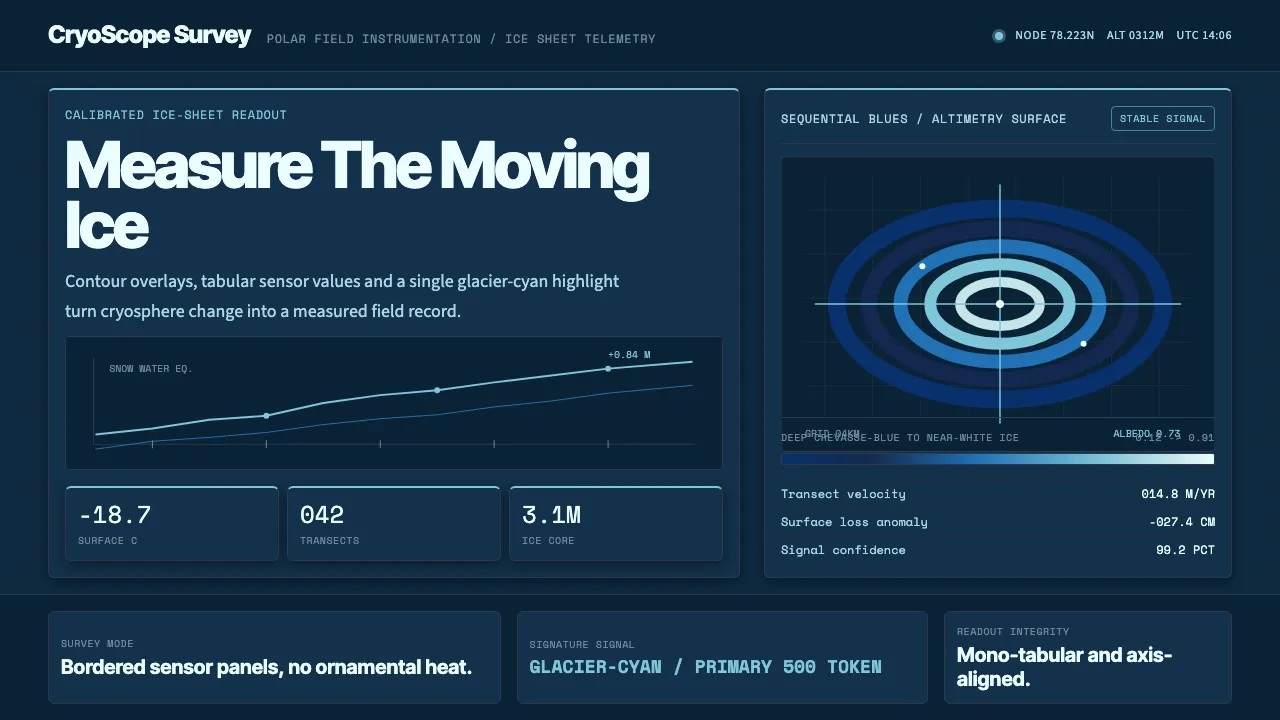
About Glacier Arctic Survey
Glacier Arctic Survey borrows the visual grammar of polar field science: the deep crevasse-blue ground of glacier ice, glacier-cyan as the instrument highlight, and the perceptually-uniform sequential Blues that NSIDC, NASA and the IPCC use to map sea ice and cryosphere change.
It is a climate-data aesthetic — contour overlays, hairline axis ticks, mono-tabular readouts and sparse charts on dark sensor panels. Nothing decorative, nothing warm: every value reads like a calibrated measurement off the ice sheet.
- Origin
- Global / polar cryosphere research (Internet)
- Era
- 2010–now (contemporary climate science visualization)
- Key figures
- Kristen Thyng · Cynthia Brewer · NSIDC
- Movements
- Scientific data visualization · Perceptually-uniform colormaps
Glacier Arctic Survey design spec
Colors
Typography
The other 11 sections — buttons, cards, spacing, motion, techniques and more — open once you unlock. Download the DESIGN.md or send it to your AI in one click. Unlock once, yours forever.
Sign up nowStyles similar to Glacier Arctic Survey
Also inspired by science & nature, with a close feel.
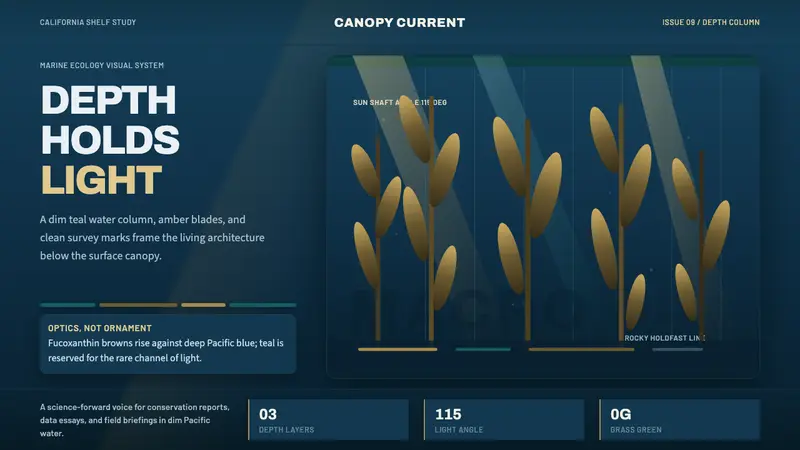 Pacific Kelp ForestScientific depth. Teal water, amber shafts, and vertical kelp rhythm carry the story.
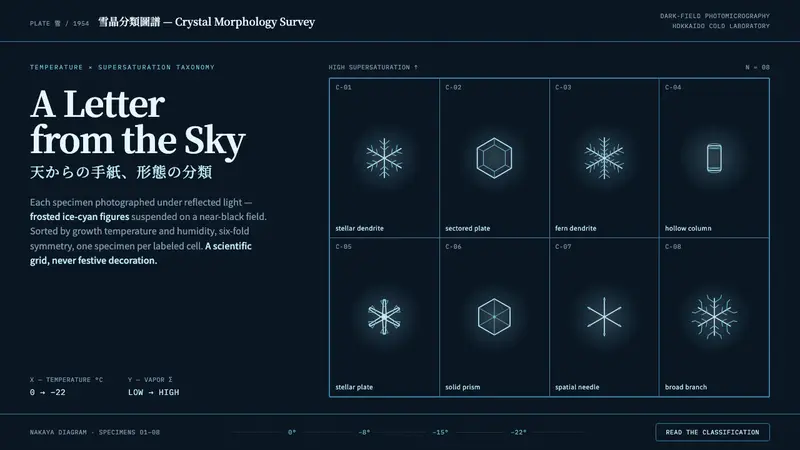 Snow Crystal ClassificationSnow as taxonomy, not decoration. Frosted ice-cyan crystals on a near-black dark-field grid.
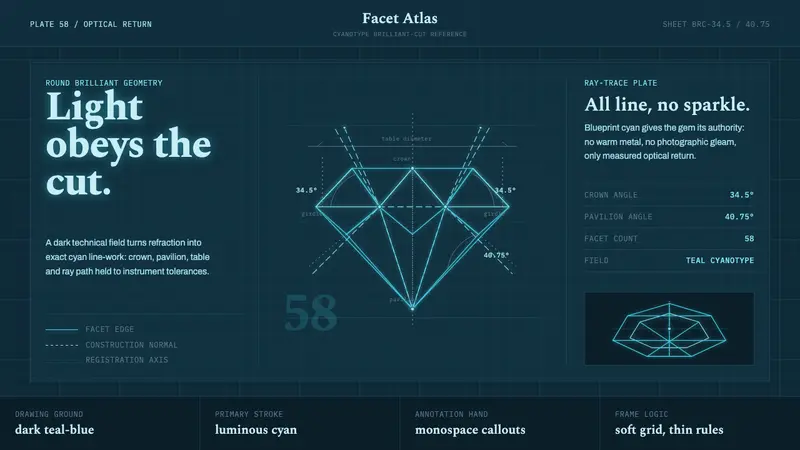 Brilliant Cut Facet DiagramOptics becomes blueprint. Cyan facet lines and ray paths glow on dark teal.
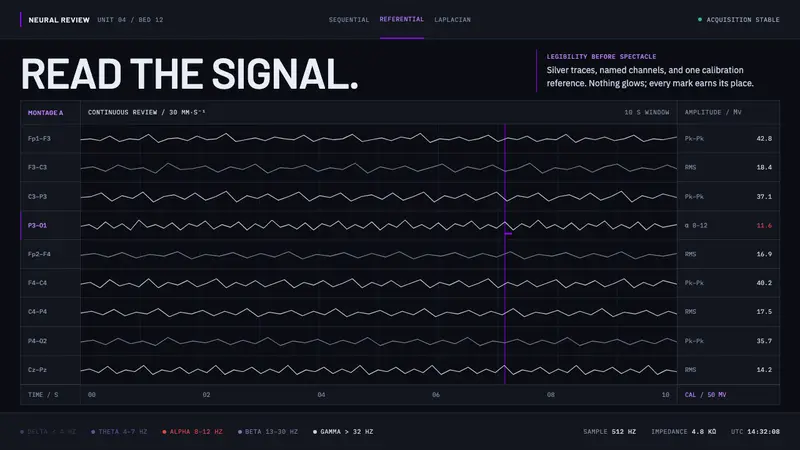 Neural Interface ClinicalClinical restraint makes signals legible. Silver traces cross near-black; violet marks calibration.