About Synoptic Weather Map
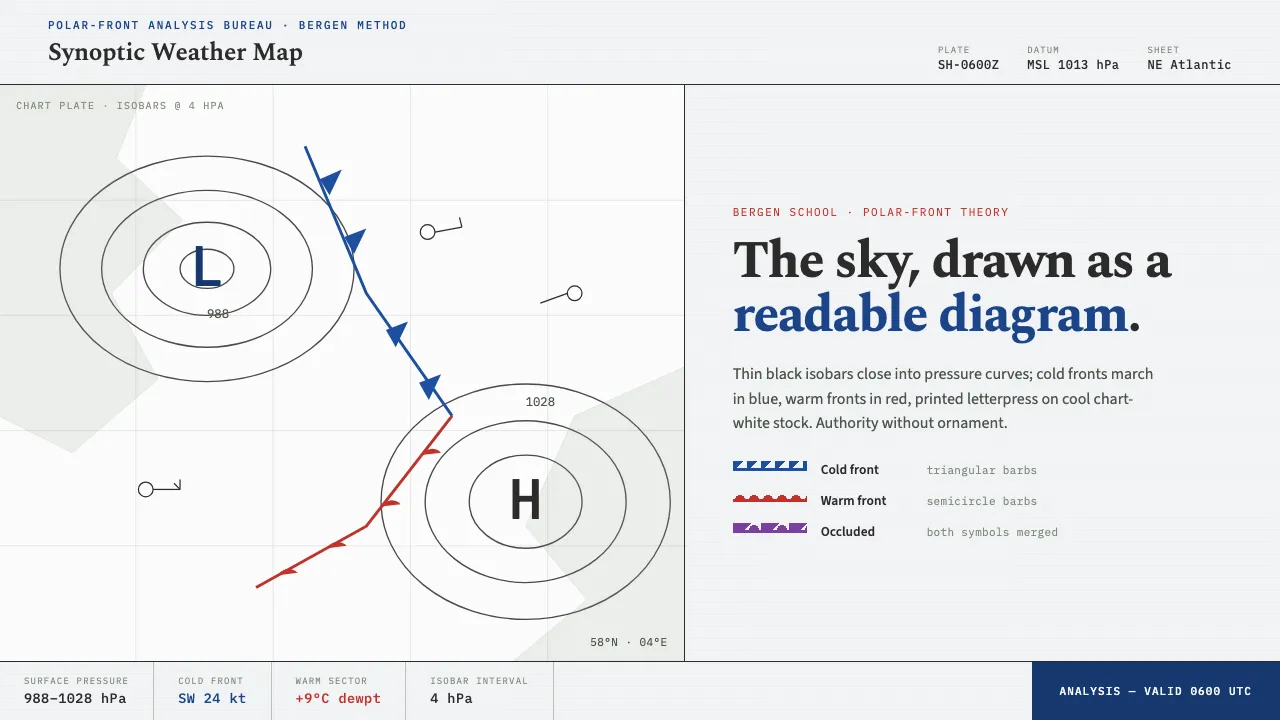
The synoptic weather map is the working drawing of early-20th-century forecasting: thin black isobars closing into pressure curves, blue cold fronts and red warm fronts marching across coastlines, and H/L marks pinning the pressure systems. Born in the Bergen School of Vilhelm and Jacob Bjerknes, it turned the sky into a readable diagram.
This design system rebuilds that printed-chart character — cool chart-white stock, cold-front blue as the signature accent, letterpress grain, and a strict line-drawn grammar of triangles, semicircles, and isobars.
- Origin
- Western Europe (Bergen, Norway; national met services)
- Era
- 1900–1950 (Bergen School front model formalized ~1918–1922)
- Key figures
- Vilhelm Bjerknes · Jacob Bjerknes · Halvor Solberg · Tor Bergeron
- Movements
- Synoptic meteorology · Bergen School polar-front theory · Standardized weather-chart cartography
Synoptic Weather Map design spec
Colors
Typography
The other 11 sections — buttons, cards, spacing, motion, techniques and more — open once you unlock. Download the DESIGN.md or send it to your AI in one click. Unlock once, yours forever.
Sign up nowStyles similar to Synoptic Weather Map
Also inspired by science & nature, with a close feel.
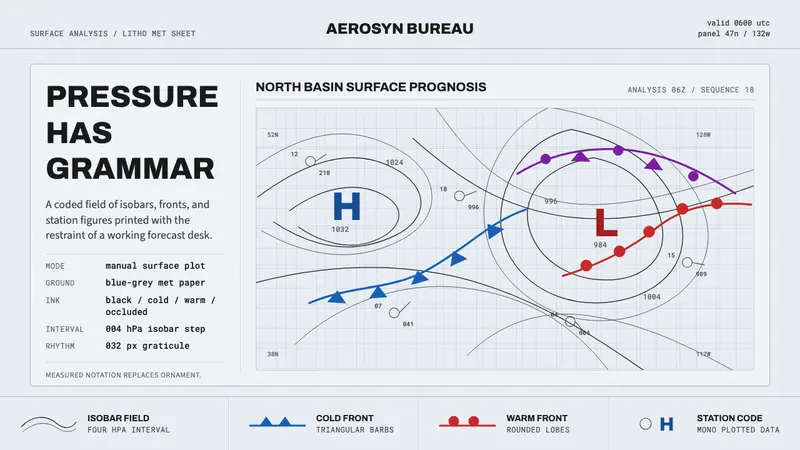 Synoptic Weather ChartPrecision reads as weather. Blue-grey graticule, thin isobars, front symbols.
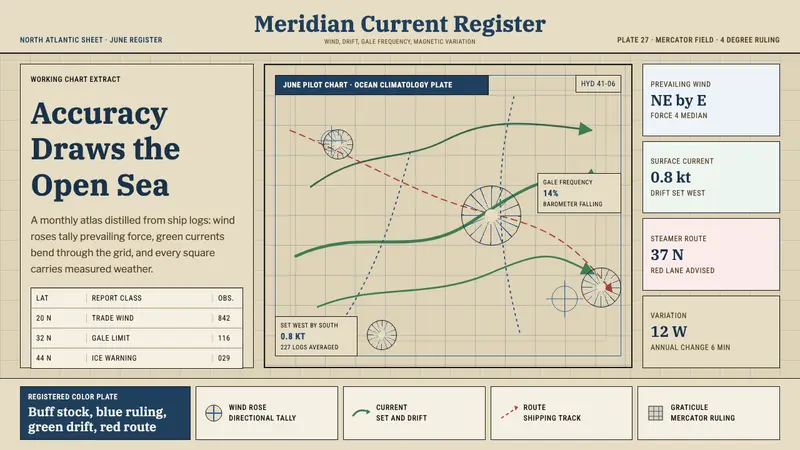 Ocean Pilot ChartAuthority by accumulation. Blue graticules and green currents crowd warm chart stock.
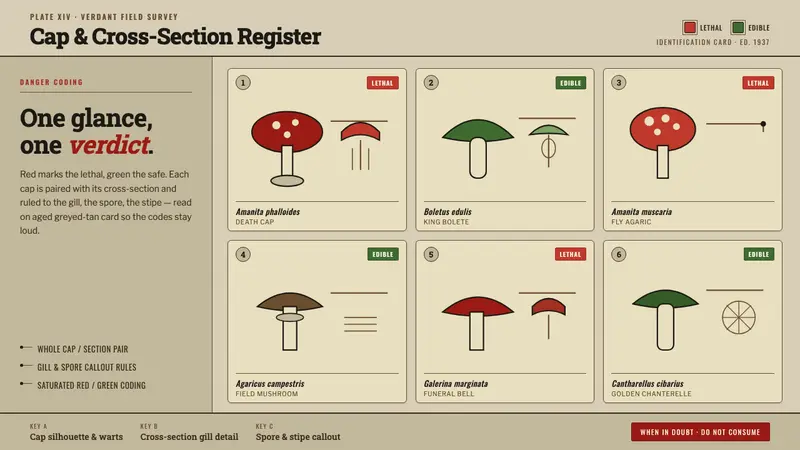 Poison Mushroom Color ChartOne glance, one verdict. Danger-red vs safe-green coding on aged greyed-tan field-guide card.
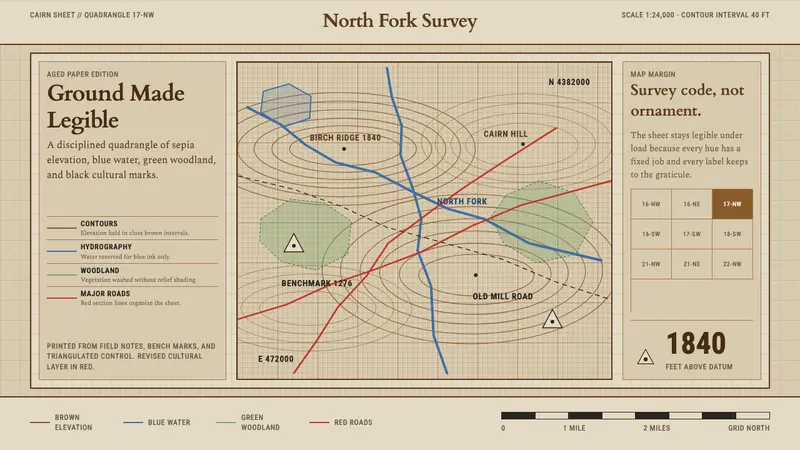 Topographic Survey MapMeasurement becomes beauty. Sepia contours and blue hydrography sit on aged map paper.