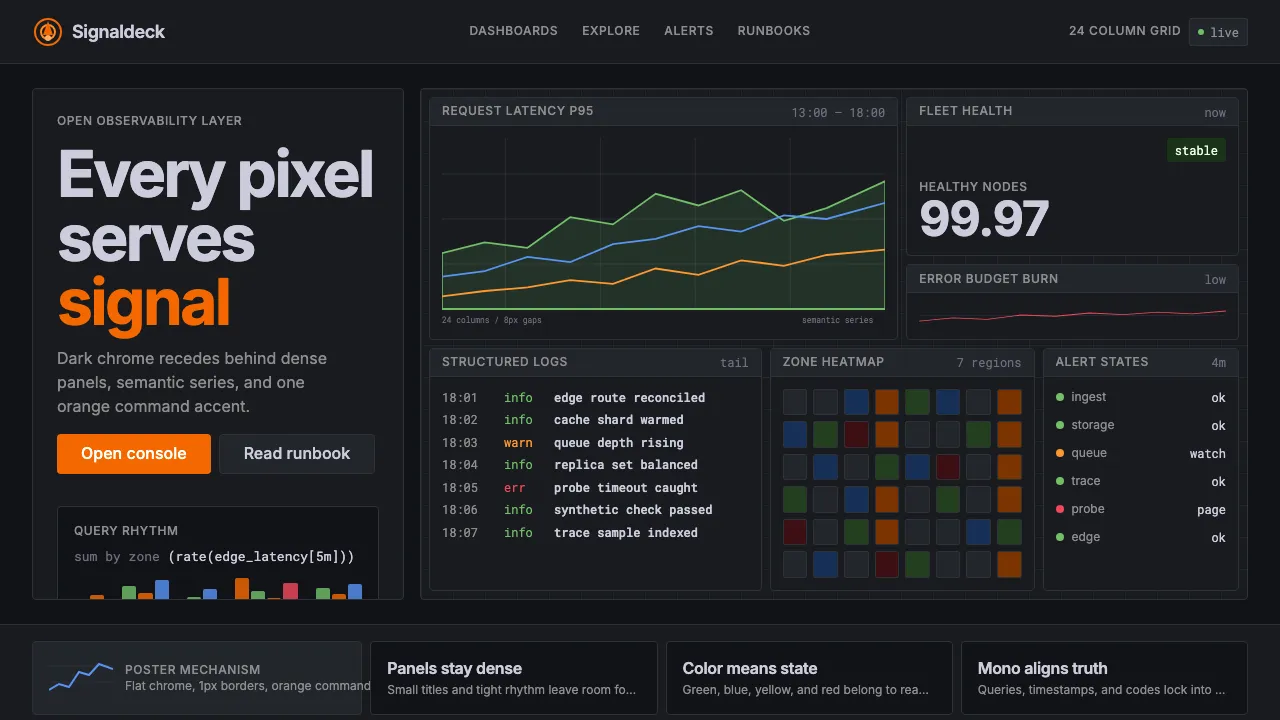
About Grafana
Grafana is the open-source observability layer that became infrastructure's default dashboard. Born as Torkel Ödegaard's 2014 fork of Kibana, it grew into the canonical visualization surface for Prometheus, Loki, and Tempo — a dark-chrome canvas where orange flame accents punctuate dense 24-column grids of time-series panels.
The visual identity reads as a friendlier Bloomberg Terminal: flat dark surfaces, tight geometry, and semantic chart colors tuned for legend distinguishability rather than decoration. Every pixel serves the data.
- Origin
- Stockholm, Sweden + New York
- Era
- 2014 first release; current visual identity ~2020–2024 (Grafana 8+ theme system)
- Key figures
- Torkel Ödegaard · Raj Dutt · Anthony Woods
- Movements
- Cloud-native observability · Open-source DevOps tooling · Dashboard-as-code culture
Grafana design spec
Colors
Typography
The other 11 sections — buttons, cards, spacing, motion, techniques and more — open once you unlock. Download the DESIGN.md or send it to your AI in one click. Unlock once, yours forever.
Sign up nowStyles similar to Grafana
Also inspired by brands & products, with a close feel.
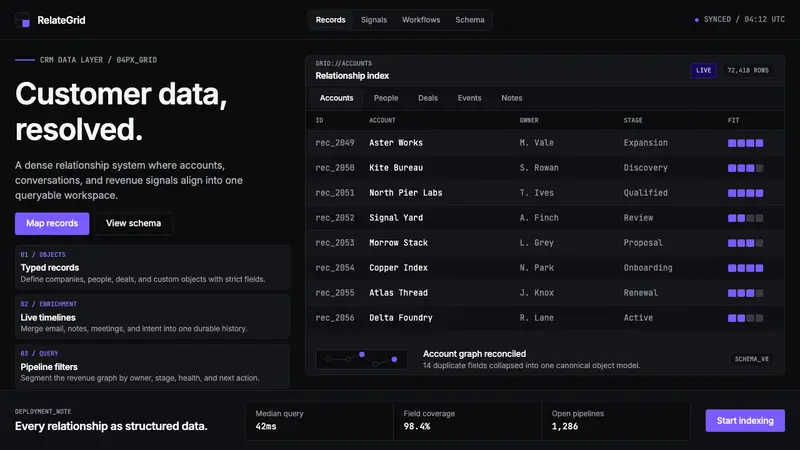 Attio CRMCRM stripped to its data layer. Single-pixel borders, monospaced IDs, violet as the only accent.
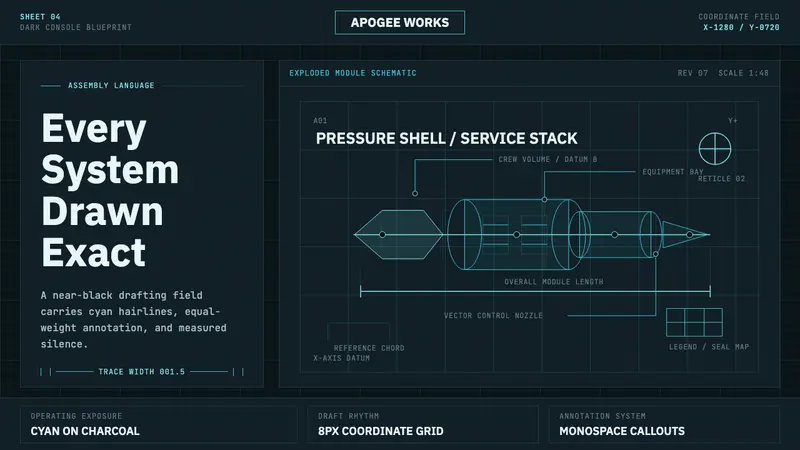 Spacecraft SchematicDrafting becomes atmosphere. Cyan hairlines and grid ticks glow on charcoal teal.
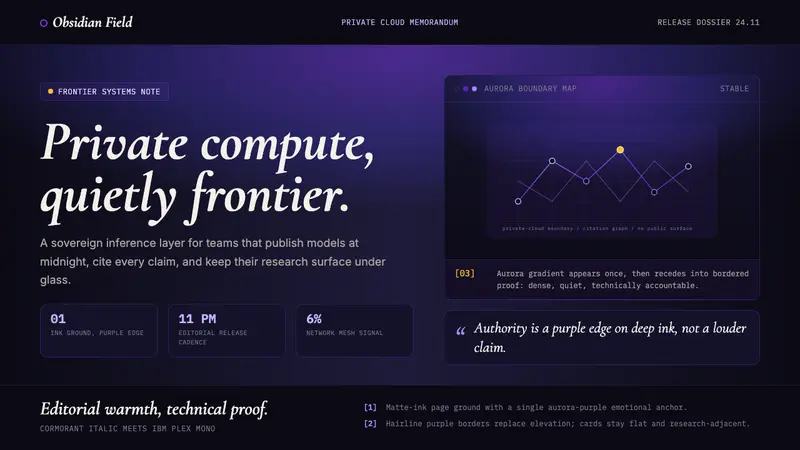 Sky App Private Cloud (2024)Quietly frontier. Aurora purple on matte ink, italic serif meets mono proof.
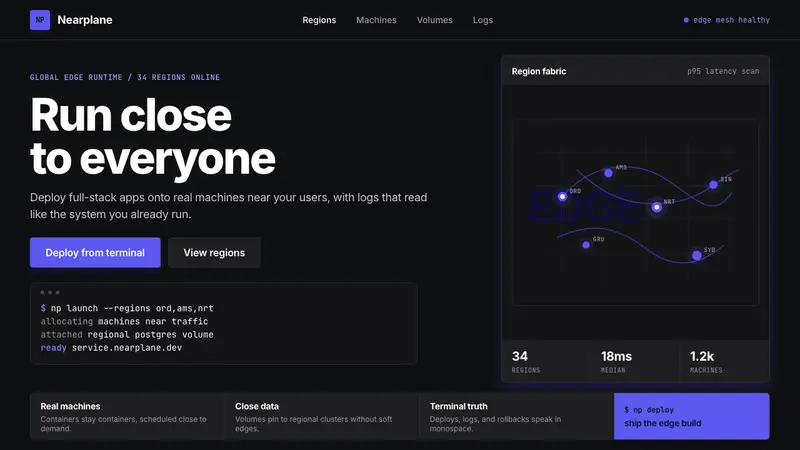 Fly.io Edge-Compute PurpleEdge-cloud with discipline. Electric purple nodes, Inter type, and terminal blocks on deep black.